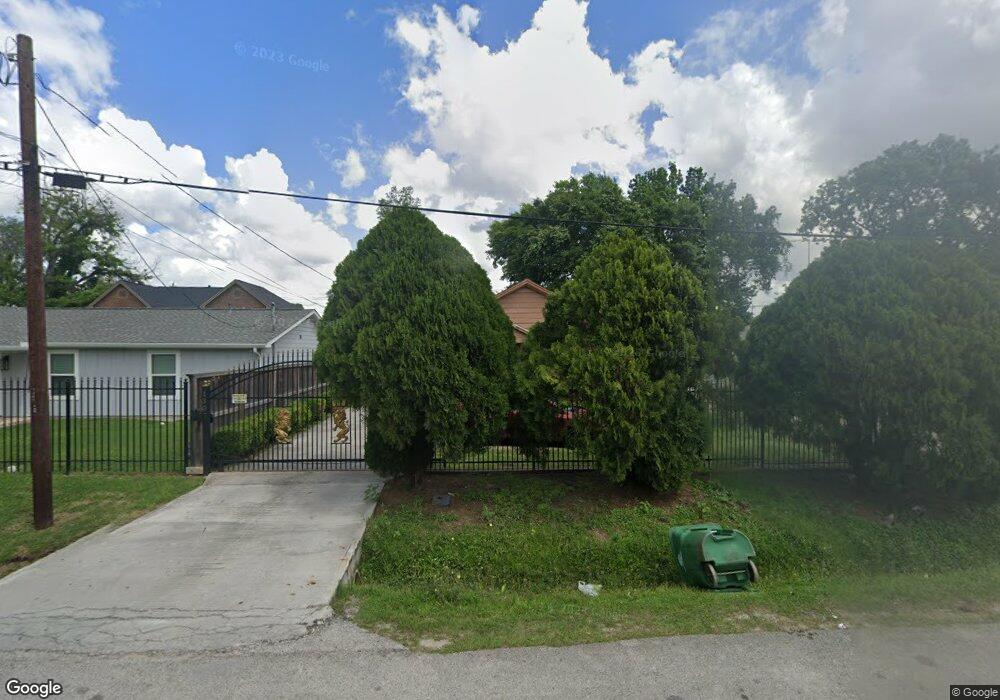
1307 Charnwood St Houston, TX 77022
Northside-Northline NeighborhoodEstimated Value: $135,344 - $199,000
2
Beds
1
Bath
792
Sq Ft
$207/Sq Ft
Est. Value
About This Home
This home is located at 1307 Charnwood St, Houston, TX 77022 and is currently estimated at $163,586, approximately $206 per square foot. 1307 Charnwood St is a home located in Harris County with nearby schools including Janowski Elementary School, Burbank Middle School, and Sam Houston Math, Science & Technology Center.
Ownership History
Date
Name
Owned For
Owner Type
Purchase Details
Closed on
Apr 16, 2015
Sold by
Cantu Delia and Barajas Delia
Bought by
Barajas Ramon
Current Estimated Value
Purchase Details
Closed on
Oct 28, 2004
Sold by
Barajas Ramon and Barajas Delia C
Bought by
Villela Jesus A L and Flores Silvia Guerra
Home Financials for this Owner
Home Financials are based on the most recent Mortgage that was taken out on this home.
Original Mortgage
$75,000
Outstanding Balance
$20,562
Interest Rate
5.73%
Mortgage Type
Seller Take Back
Estimated Equity
$143,024
Purchase Details
Closed on
Oct 24, 1997
Sold by
Rodriguez Ester D and Rodriguez Emilio
Bought by
Barajas Ramon and Barajas Delia
Home Financials for this Owner
Home Financials are based on the most recent Mortgage that was taken out on this home.
Original Mortgage
$25,500
Interest Rate
7.52%
Mortgage Type
Seller Take Back
Create a Home Valuation Report for This Property
The Home Valuation Report is an in-depth analysis detailing your home's value as well as a comparison with similar homes in the area
Home Values in the Area
Average Home Value in this Area
Purchase History
| Date | Buyer | Sale Price | Title Company |
|---|---|---|---|
| Barajas Ramon | -- | None Available | |
| Villela Jesus A L | -- | -- | |
| Barajas Ramon | -- | -- |
Source: Public Records
Mortgage History
| Date | Status | Borrower | Loan Amount |
|---|---|---|---|
| Open | Villela Jesus A L | $75,000 | |
| Previous Owner | Barajas Ramon | $25,500 |
Source: Public Records
Tax History Compared to Growth
Tax History
| Year | Tax Paid | Tax Assessment Tax Assessment Total Assessment is a certain percentage of the fair market value that is determined by local assessors to be the total taxable value of land and additions on the property. | Land | Improvement |
|---|---|---|---|---|
| 2025 | $2,382 | $121,539 | $85,880 | $35,659 |
| 2024 | $2,382 | $113,822 | $78,818 | $35,004 |
| 2023 | $2,382 | $103,156 | $48,025 | $55,131 |
| 2022 | $2,000 | $90,852 | $48,025 | $42,827 |
| 2021 | $1,841 | $79,008 | $48,025 | $30,983 |
| 2020 | $1,813 | $74,880 | $48,025 | $26,855 |
| 2019 | $1,721 | $68,031 | $39,550 | $28,481 |
| 2018 | $1,395 | $55,115 | $33,053 | $22,062 |
| 2017 | $1,394 | $55,115 | $33,053 | $22,062 |
| 2016 | $1,301 | $51,451 | $31,075 | $20,376 |
| 2015 | $720 | $43,559 | $22,600 | $20,959 |
| 2014 | $720 | $43,559 | $22,600 | $20,959 |
Source: Public Records
Map
Nearby Homes
- 8109 W Hardy Rd
- 1104 Charnwood St
- 1016 Apache St
- 743 Apache St
- 1207 Firnat St
- 714 Apache St
- 8411 Berry Brush Ln
- 631 Apache St
- 8402 Berry Green Ln
- 741 Mcdaniel St
- 802 Berry Sage Ln
- 723 Doverside St
- 726 Mcdaniel St
- 729 Caperton St
- 807 Firnat St
- 8718 Brannon St
- 1817 Mcdaniel St
- 2017 Sadler St
- 88 Berry Rd
- 8205 Appleton St
- 1311 Charnwood St
- 1303 Charnwood St
- 1303 Charnwood St
- 1313 Charnwood St
- 1225 Charnwood St
- 1317 Charnwood St
- 1304 Charnwood St
- 1302 Charnwood St
- 1321 Charnwood St
- 1236 Charnwood St
- 1314 Charnwood St
- 1323 Charnwood St
- 1221 Charnwood St
- 1318 Charnwood St
- 1224 Charnwood St
- 1301 Norham St
- 1235 Norham St
- 1303 Norham St
- 1237 Norham St
- 1228 Charnwood St