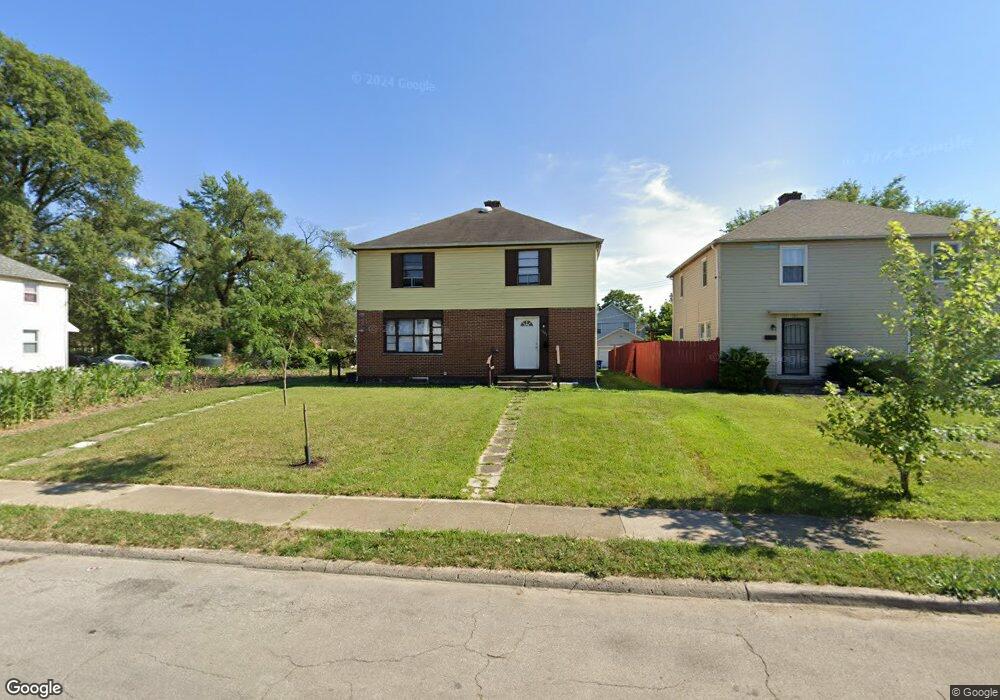
1307 E 25th Ave Unit 1309 Columbus, OH 43211
South Linden NeighborhoodEstimated Value: $166,498 - $189,000
4
Beds
2
Baths
1,792
Sq Ft
$100/Sq Ft
Est. Value
About This Home
This home is located at 1307 E 25th Ave Unit 1309, Columbus, OH 43211 and is currently estimated at $179,375, approximately $100 per square foot. 1307 E 25th Ave Unit 1309 is a home located in Franklin County with nearby schools including Windsor Stem Acadmey, Linden-Mckinley Stem School On Arcadia, and North Columbus Preparatory Academy.
Ownership History
Date
Name
Owned For
Owner Type
Purchase Details
Closed on
Nov 25, 2015
Sold by
Arunachalam Vivekanandan
Bought by
Kjb Homes Llc
Current Estimated Value
Purchase Details
Closed on
Aug 4, 2006
Sold by
Nwaru Stella U and Case #05Cve06 6903
Bought by
Wells Fargo Bank Minnesota Na and Southern Pacific Secured Assets Corp Mor
Purchase Details
Closed on
May 14, 1997
Sold by
Cedar Bay Investment Inc
Bought by
Nwaru Simon and Nwaru Stella
Home Financials for this Owner
Home Financials are based on the most recent Mortgage that was taken out on this home.
Original Mortgage
$52,650
Interest Rate
9%
Mortgage Type
Seller Take Back
Purchase Details
Closed on
Mar 15, 1994
Bought by
Cedar Bay Investments Inc
Purchase Details
Closed on
Jun 15, 1993
Purchase Details
Closed on
May 8, 1990
Create a Home Valuation Report for This Property
The Home Valuation Report is an in-depth analysis detailing your home's value as well as a comparison with similar homes in the area
Home Values in the Area
Average Home Value in this Area
Purchase History
| Date | Buyer | Sale Price | Title Company |
|---|---|---|---|
| Kjb Homes Llc | $10,500 | Tlc Title | |
| Wells Fargo Bank Minnesota Na | $32,000 | None Available | |
| Nwaru Simon | $58,500 | Connor Title Co | |
| Cedar Bay Investments Inc | -- | -- | |
| -- | -- | -- | |
| -- | $33,500 | -- |
Source: Public Records
Mortgage History
| Date | Status | Borrower | Loan Amount |
|---|---|---|---|
| Previous Owner | Nwaru Simon | $52,650 |
Source: Public Records
Tax History Compared to Growth
Tax History
| Year | Tax Paid | Tax Assessment Tax Assessment Total Assessment is a certain percentage of the fair market value that is determined by local assessors to be the total taxable value of land and additions on the property. | Land | Improvement |
|---|---|---|---|---|
| 2024 | $2,013 | $43,930 | $5,850 | $38,080 |
| 2023 | $1,988 | $43,925 | $5,845 | $38,080 |
| 2022 | $793 | $14,920 | $3,330 | $11,590 |
| 2021 | $794 | $14,920 | $3,330 | $11,590 |
| 2020 | $795 | $14,920 | $3,330 | $11,590 |
| 2019 | $1,177 | $12,430 | $2,770 | $9,660 |
| 2018 | $326 | $10,510 | $2,770 | $7,740 |
| 2017 | $977 | $15,720 | $2,770 | $12,950 |
| 2016 | $310 | $4,560 | $3,540 | $1,020 |
| 2015 | $141 | $4,560 | $3,540 | $1,020 |
| 2014 | $999 | $4,560 | $3,540 | $1,020 |
| 2013 | $547 | $17,885 | $3,920 | $13,965 |
Source: Public Records
Map
Nearby Homes
- 1335 E 25th Ave Unit 337
- 1271 E 24th Ave
- 1326 E 23rd Ave
- 1339 Duxberry Ave
- 1231 E 23rd Ave
- 1384 E 23rd Ave
- 1371 E 23rd Ave
- 1386 E 22nd Ave
- 1400 E Maynard Ave
- 1161 E 22nd Ave Unit 1159
- 0 E Maynard Ave
- 2107 Cleveland Ave
- 1136 E 21st Ave
- 2214 Medina Ave
- 2126 Cleveland Ave
- 2225 Medina Ave
- 1288-1292 E 19th Ave
- 1457 Cordell Ave
- 1088 E 21st Ave
- 2210 Gerbert Rd
- 1307-1309 E 25th Ave
- 1301 E 25th Ave
- 1317 E 20th Ave
- 1315 E 25th Ave Unit 1317
- 1293 E 25th Ave Unit 1295
- 1321 E 25th Ave
- 1321 E 25th Ave Unit 323
- 1323 E 20th Ave
- 1306 E 25th Ave
- 1304 E 24th Ave
- 1329 E 25th Ave Unit 1331
- 1329 E 25th Ave Unit 331
- 1310 E 25th Ave Unit 1312
- 1304 E 25th Ave Unit 1306
- 1304 E 25th Ave Unit 306
- 1316 E 25th Ave Unit 1318
- 1292 E 24th Ave
- 1310 E 24th Ave
- 1296 E 25th Ave
- 1281 Twenty Fifth Ave