Estimated Value: $310,000 - $333,000
3
Beds
2
Baths
1,537
Sq Ft
$206/Sq Ft
Est. Value
About This Home
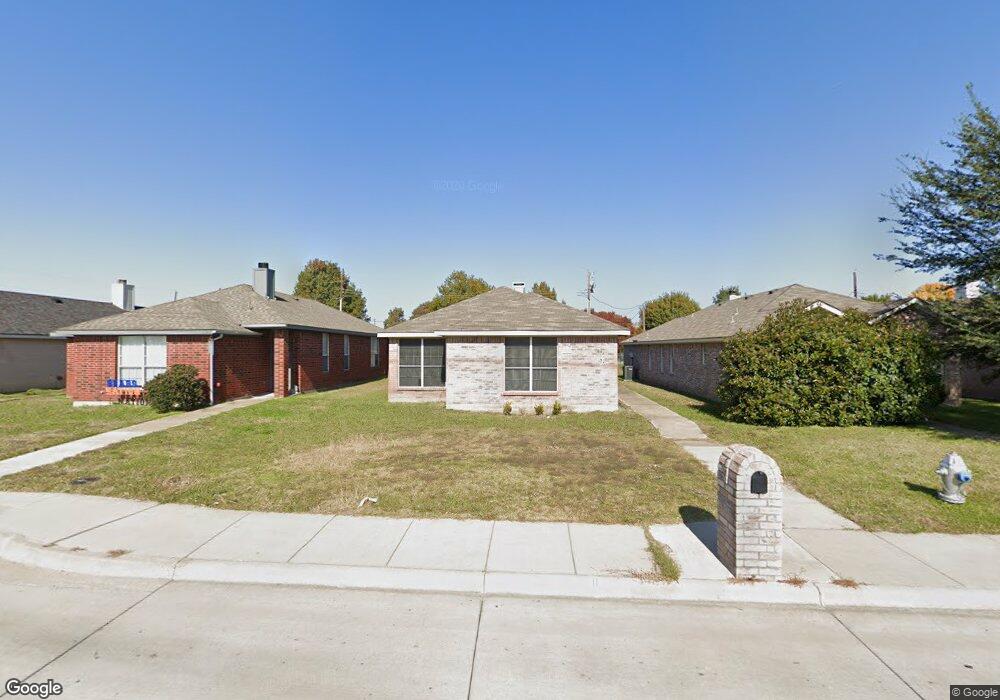
This home is located at 1307 E Brown St, Wylie, TX 75098 and is currently estimated at $317,090, approximately $206 per square foot. 1307 E Brown St is a home located in Collin County with nearby schools including P M Akin Elementary School, AB Harrison Intermediate School, and Grady Burnett J High School.
Ownership History
Date
Name
Owned For
Owner Type
Purchase Details
Closed on
Sep 12, 2008
Sold by
Moore Jerry and Moore Sara
Bought by
Bolls Marva
Current Estimated Value
Home Financials for this Owner
Home Financials are based on the most recent Mortgage that was taken out on this home.
Original Mortgage
$105,899
Outstanding Balance
$70,707
Interest Rate
6.6%
Mortgage Type
Purchase Money Mortgage
Estimated Equity
$246,383
Purchase Details
Closed on
Jun 26, 2002
Sold by
Cassity Matthew R and Cassity Jodie M
Bought by
Moore Jerry and Moore Sara
Home Financials for this Owner
Home Financials are based on the most recent Mortgage that was taken out on this home.
Original Mortgage
$109,900
Interest Rate
6.89%
Purchase Details
Closed on
Aug 27, 1998
Sold by
Choice Homes Texas Inc
Bought by
Cassity Matthew R and Cassity Jodie M
Home Financials for this Owner
Home Financials are based on the most recent Mortgage that was taken out on this home.
Original Mortgage
$81,753
Interest Rate
6.94%
Mortgage Type
VA
Create a Home Valuation Report for This Property
The Home Valuation Report is an in-depth analysis detailing your home's value as well as a comparison with similar homes in the area
Home Values in the Area
Average Home Value in this Area
Purchase History
| Date | Buyer | Sale Price | Title Company |
|---|---|---|---|
| Bolls Marva | -- | Atc | |
| Moore Jerry | -- | -- | |
| Cassity Matthew R | -- | -- |
Source: Public Records
Mortgage History
| Date | Status | Borrower | Loan Amount |
|---|---|---|---|
| Open | Bolls Marva | $105,899 | |
| Previous Owner | Moore Jerry | $109,900 | |
| Previous Owner | Cassity Matthew R | $81,753 |
Source: Public Records
Tax History Compared to Growth
Tax History
| Year | Tax Paid | Tax Assessment Tax Assessment Total Assessment is a certain percentage of the fair market value that is determined by local assessors to be the total taxable value of land and additions on the property. | Land | Improvement |
|---|---|---|---|---|
| 2025 | $4,239 | $282,828 | $65,025 | $217,803 |
| 2024 | $4,239 | $279,627 | $65,025 | $244,696 |
| 2023 | $4,239 | $254,206 | $65,025 | $199,040 |
| 2022 | $5,070 | $231,096 | $53,550 | $209,161 |
| 2021 | $4,943 | $213,110 | $42,075 | $171,035 |
| 2020 | $4,742 | $208,091 | $34,425 | $173,666 |
| 2019 | $4,563 | $173,625 | $34,425 | $150,205 |
| 2018 | $4,251 | $157,841 | $34,425 | $146,420 |
| 2017 | $3,864 | $147,962 | $30,600 | $117,362 |
| 2016 | $3,624 | $141,101 | $22,950 | $118,151 |
| 2015 | $2,798 | $126,475 | $22,950 | $103,525 |
Source: Public Records
Map
Nearby Homes
- 1308 London Dr
- 1312 Wyndham Dr
- 107 Windy Knoll Ln
- 1056 Fairview Dr
- 213 N West A Allen Blvd
- 1115 Nighthawk Dr
- 209 Duck Blind Ave
- 2801-3 N State Highway 78
- 2801-1 N State Highway 78
- 1209 Surrey Cir
- 2800 Gold Hill Dr
- 312 Maltese Cir
- 211 Rutherford Ave
- 207 Gatwick Ct
- 407 Sparrow Dr
- 508 Weston St
- 306 Foxwood Ct
- 310 Hawthorn Dr
- 304 Hawthorn Dr
- 702 Lynda Ln
- 1309 E Brown St
- 1305 E Brown St
- 1311 E Brown St
- 1303 E Brown St
- 1313 E Brown St
- 1301 E Brown St
- 201 Parliament Dr
- 1315 E Brown St
- 1401 E Brown St
- 1310 London Dr
- 203 Parliament Dr
- 200 Piccadilly Cir
- 202 Piccadilly Cir
- 204 Piccadilly Cir
- 1403 E Brown St
- 206 Piccadilly Cir
- 1312 London Dr
- 208 Piccadilly Cir
- 1405 E Brown St
- 210 Piccadilly Cir