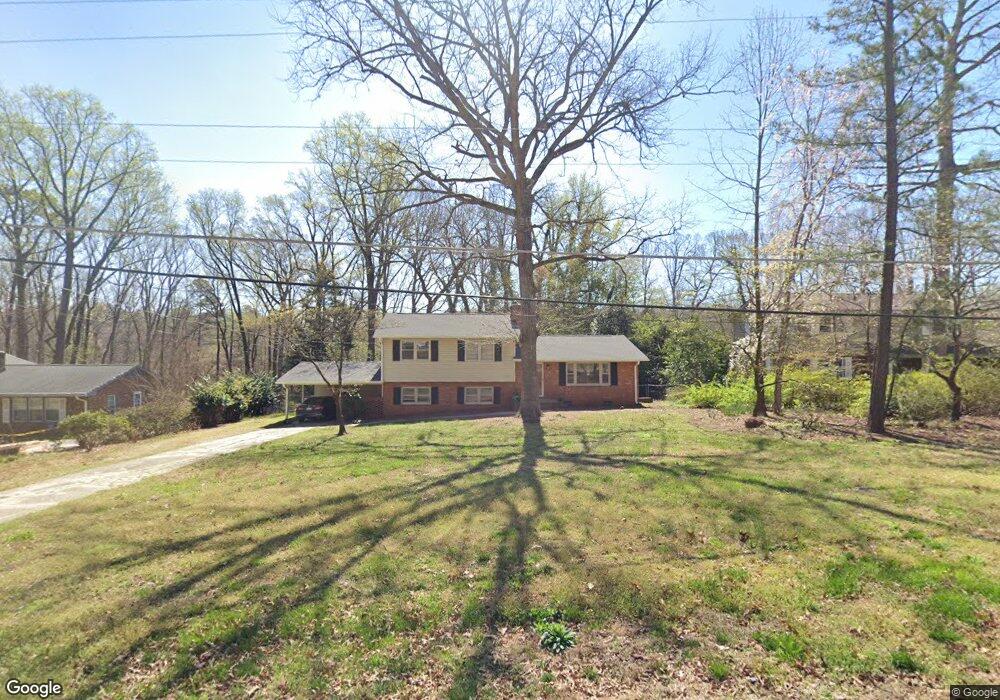
1307 Kingston Ridge Rd Cary, NC 27511
South Cary NeighborhoodEstimated Value: $462,714 - $514,000
3
Beds
3
Baths
1,872
Sq Ft
$264/Sq Ft
Est. Value
About This Home
This home is located at 1307 Kingston Ridge Rd, Cary, NC 27511 and is currently estimated at $493,929, approximately $263 per square foot. 1307 Kingston Ridge Rd is a home located in Wake County with nearby schools including Briarcliff Elementary School, East Cary Middle School, and Cary High School.
Ownership History
Date
Name
Owned For
Owner Type
Purchase Details
Closed on
Jul 27, 2006
Sold by
Hsbc Mortgage Service Inc
Bought by
Chernoff Eric S and Cho Michael
Current Estimated Value
Home Financials for this Owner
Home Financials are based on the most recent Mortgage that was taken out on this home.
Original Mortgage
$124,000
Outstanding Balance
$73,798
Interest Rate
6.6%
Mortgage Type
New Conventional
Estimated Equity
$420,131
Purchase Details
Closed on
Nov 7, 2000
Sold by
Hagan Roberts Michael Reis and Leslie Anne
Bought by
Roberts Michael Reis and Roberts Leslie Anne
Purchase Details
Closed on
Feb 27, 1998
Sold by
Williams Robert T
Bought by
Roberts Michael Reis and Hagan Leslie Anne
Home Financials for this Owner
Home Financials are based on the most recent Mortgage that was taken out on this home.
Original Mortgage
$131,595
Interest Rate
6.86%
Mortgage Type
FHA
Create a Home Valuation Report for This Property
The Home Valuation Report is an in-depth analysis detailing your home's value as well as a comparison with similar homes in the area
Home Values in the Area
Average Home Value in this Area
Purchase History
| Date | Buyer | Sale Price | Title Company |
|---|---|---|---|
| Chernoff Eric S | $155,000 | None Available | |
| Roberts Michael Reis | -- | -- | |
| Roberts Michael Reis | $133,000 | -- |
Source: Public Records
Mortgage History
| Date | Status | Borrower | Loan Amount |
|---|---|---|---|
| Open | Chernoff Eric S | $124,000 | |
| Closed | Chernoff Eric S | $15,475 | |
| Previous Owner | Roberts Michael Reis | $131,595 |
Source: Public Records
Tax History Compared to Growth
Tax History
| Year | Tax Paid | Tax Assessment Tax Assessment Total Assessment is a certain percentage of the fair market value that is determined by local assessors to be the total taxable value of land and additions on the property. | Land | Improvement |
|---|---|---|---|---|
| 2025 | $3,529 | $409,418 | $213,750 | $195,668 |
| 2024 | $3,453 | $409,418 | $213,750 | $195,668 |
| 2023 | $2,663 | $263,777 | $118,750 | $145,027 |
| 2022 | $2,564 | $263,777 | $118,750 | $145,027 |
| 2021 | $2,513 | $263,777 | $118,750 | $145,027 |
| 2020 | $2,526 | $263,777 | $118,750 | $145,027 |
| 2019 | $2,173 | $201,115 | $81,600 | $119,515 |
| 2018 | $2,040 | $201,115 | $81,600 | $119,515 |
| 2017 | $1,961 | $201,115 | $81,600 | $119,515 |
| 2016 | $1,932 | $201,115 | $81,600 | $119,515 |
| 2015 | $1,832 | $184,045 | $68,000 | $116,045 |
| 2014 | $1,728 | $184,045 | $68,000 | $116,045 |
Source: Public Records
Map
Nearby Homes
- 1229 Fairlane Rd
- 1331 Kingston Ridge Rd
- 208 Lawrence Rd
- 104 Catherwood Place
- 109 Beaver Pine Way
- 2015 Piney Plains Rd
- 2434 Stephens Rd
- 1414 Debra Dr
- 1728 Callandale Ave
- 1201 Deerfield Dr
- 121 Bay Dr
- 1641 Kildonan Place
- 2414 Stephens Rd
- 307 Durington Place
- 902 Vickie Dr
- 702 Delmar Rd
- 1640 Glengarry Dr
- 1244 Donaldson Ct
- 1214 Kimbolton Dr
- 1216 Walnut St
- 1309 Kingston Ridge Rd
- 1305 Kingston Ridge Rd
- 1311 Kingston Ridge Rd
- 1301 Kingston Ridge Rd
- 1304 Kingston Ridge Rd
- 1302 Kingston Ridge Rd
- 1108 Kingston Ridge Rd
- 1241 Kingston Ridge Rd
- 1108 Kingston Ridge Rd Unit 1
- 1310 Kingston Ridge Rd
- 1313 Kingston Ridge Rd
- 1300 Kingston Ridge Rd
- 1312 Kingston Ridge Rd
- 1221 Pioneer Ct
- 1604 Fairlane Rd
- 1252 Fairlane Rd
- 1237 Kingston Ridge Rd
- 1220 Imperial Rd
- 1315 Kingston Ridge Rd
- 1314 Kingston Ridge Rd