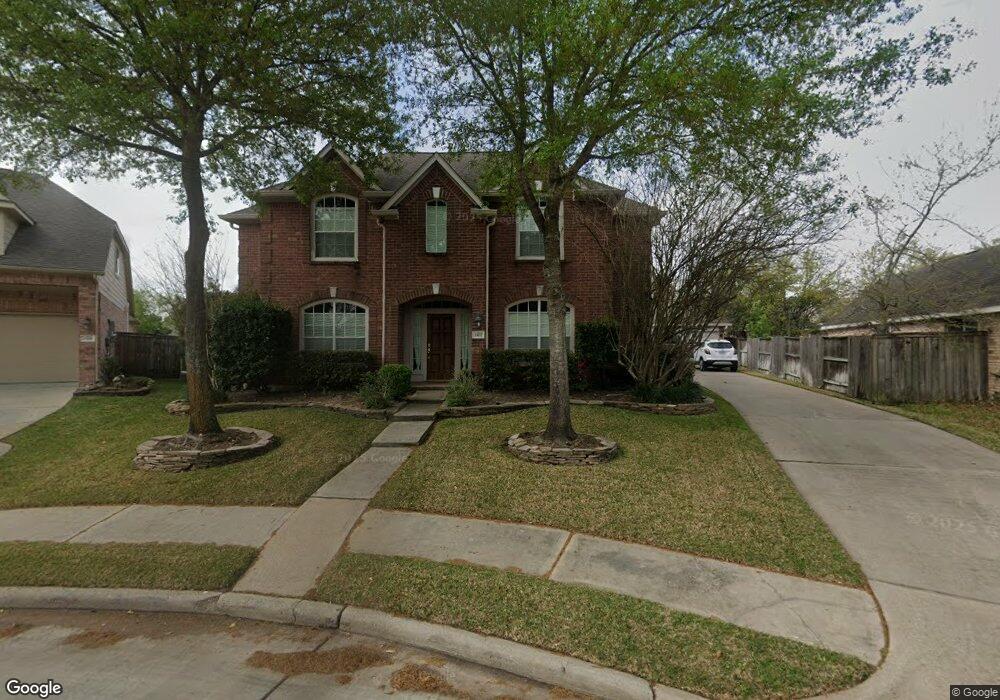
1307 Matson Manor Ct Spring, TX 77379
Gleannloch Farms NeighborhoodEstimated Value: $465,000 - $493,000
4
Beds
4
Baths
3,121
Sq Ft
$154/Sq Ft
Est. Value
About This Home
This home is located at 1307 Matson Manor Ct, Spring, TX 77379 and is currently estimated at $480,229, approximately $153 per square foot. 1307 Matson Manor Ct is a home located in Harris County with nearby schools including Hassler Elementary School, Doerre Intermediate School, and Klein Cain High School.
Ownership History
Date
Name
Owned For
Owner Type
Purchase Details
Closed on
Nov 18, 2016
Sold by
Gibson Michael Lane and Gibson Terri Brown
Bought by
Schnabi Florestela and Schnabi Lawrence
Current Estimated Value
Home Financials for this Owner
Home Financials are based on the most recent Mortgage that was taken out on this home.
Original Mortgage
$299,250
Outstanding Balance
$240,246
Interest Rate
3.42%
Mortgage Type
New Conventional
Estimated Equity
$239,983
Purchase Details
Closed on
Jul 17, 2000
Sold by
Mhi Partnership Ltd
Bought by
Gibson Michael Lane and Gibson Terri Brown
Home Financials for this Owner
Home Financials are based on the most recent Mortgage that was taken out on this home.
Original Mortgage
$207,261
Interest Rate
8.23%
Purchase Details
Closed on
Mar 30, 2000
Sold by
Champions Glen Lp
Bought by
Mhi Partnership Ltd
Create a Home Valuation Report for This Property
The Home Valuation Report is an in-depth analysis detailing your home's value as well as a comparison with similar homes in the area
Home Values in the Area
Average Home Value in this Area
Purchase History
| Date | Buyer | Sale Price | Title Company |
|---|---|---|---|
| Schnabi Florestela | -- | Capital Title | |
| Gibson Michael Lane | -- | Millennium Title | |
| Mhi Partnership Ltd | -- | Stewart Title Company |
Source: Public Records
Mortgage History
| Date | Status | Borrower | Loan Amount |
|---|---|---|---|
| Open | Schnabi Florestela | $299,250 | |
| Previous Owner | Gibson Michael Lane | $207,261 |
Source: Public Records
Tax History Compared to Growth
Tax History
| Year | Tax Paid | Tax Assessment Tax Assessment Total Assessment is a certain percentage of the fair market value that is determined by local assessors to be the total taxable value of land and additions on the property. | Land | Improvement |
|---|---|---|---|---|
| 2025 | $7,699 | $447,904 | $71,246 | $376,658 |
| 2024 | $7,699 | $439,709 | $71,246 | $368,463 |
| 2023 | $7,699 | $442,024 | $71,246 | $370,778 |
| 2022 | $9,307 | $398,379 | $62,864 | $335,515 |
| 2021 | $9,151 | $356,581 | $45,262 | $311,319 |
| 2020 | $8,756 | $318,546 | $45,262 | $273,284 |
| 2019 | $8,748 | $304,947 | $45,262 | $259,685 |
| 2018 | $4,003 | $304,947 | $45,262 | $259,685 |
| 2017 | $8,791 | $304,947 | $45,262 | $259,685 |
| 2016 | $7,771 | $269,556 | $45,262 | $224,294 |
| 2015 | $5,988 | $275,000 | $45,262 | $229,738 |
| 2014 | $5,988 | $265,000 | $45,262 | $219,738 |
Source: Public Records
Map
Nearby Homes
- 1206 Bala Lake Ct
- 1018 Bringewood Chase Dr
- 9515 Sotherloch Lake Dr
- 9602 Fairymoss Ct
- 8823 Leaning Hollow Ln
- 18606 Copano Ln
- 35 Gleannloch Estates Dr
- 9206 Memorial Hills Dr
- 9710 Wild Orange Ct
- 9607 Woodcliff Lake Dr
- 9102 Memorial Hills Dr
- 9218 Memorial Pines Way
- 17423 Victoria Lakes Cir
- 1514 Robins Forest Dr
- 18307 Running Vine Ln
- 26717 Stockton Trail
- 26905 S Ranch House Rd
- 26520 Pioneer Pointe Ct
- 26913 S Ranch House Rd
- 26822 Mustang Springs Ct
- 1311 Matson Manor Ct
- 1303 Matson Manor Ct
- 1310 Bishops Place Dr
- 1314 Bishops Place Dr
- 1315 Matson Manor Ct
- 1306 Bishops Place Dr
- 1302 Matson Manor Ct
- 1318 Bishops Place Dr
- 1319 Matson Manor Ct
- 1310 Matson Manor Ct
- 1322 Bishops Place Dr
- 1306 Matson Manor Ct
- 1314 Matson Manor Ct
- 1318 Matson Manor Ct
- 1303 Bishops Place Dr
- 1326 Bishops Place Dr
- 1323 Matson Manor Ct
- 1322 Matson Manor Ct
- 1330 Bishops Place Dr
- 1307 Belham Ridge Ct