Estimated Value: $423,208 - $537,000
3
Beds
1
Bath
996
Sq Ft
$463/Sq Ft
Est. Value
About This Home
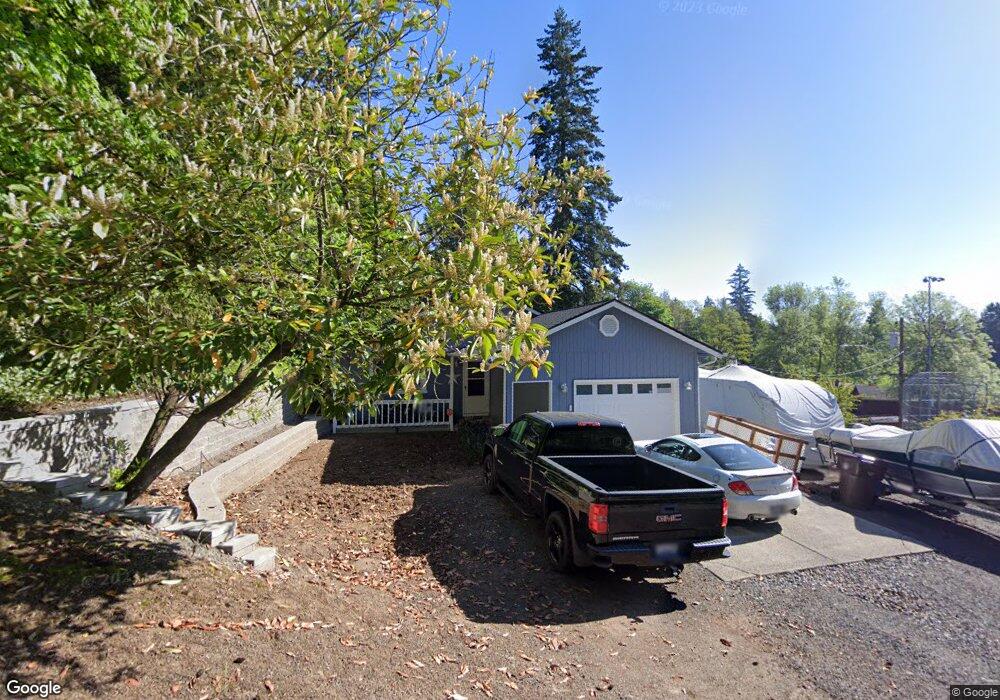
This home is located at 1307 NW Maple Ln, Camas, WA 98607 and is currently estimated at $461,552, approximately $463 per square foot. 1307 NW Maple Ln is a home located in Clark County with nearby schools including Prune Hill Elementary School, Skyridge Middle School, and Camas High School.
Ownership History
Date
Name
Owned For
Owner Type
Purchase Details
Closed on
Feb 9, 2007
Sold by
Tjan Anita G
Bought by
Powell Donald R and Powell Cindy M
Current Estimated Value
Home Financials for this Owner
Home Financials are based on the most recent Mortgage that was taken out on this home.
Original Mortgage
$29,175
Interest Rate
6.21%
Mortgage Type
Stand Alone Second
Purchase Details
Closed on
May 23, 1996
Sold by
Quality Choice Homes Inc
Bought by
Tjan Anita G
Home Financials for this Owner
Home Financials are based on the most recent Mortgage that was taken out on this home.
Original Mortgage
$85,650
Interest Rate
7.97%
Mortgage Type
Balloon
Purchase Details
Closed on
Feb 12, 1996
Sold by
Eby Donald E and Eby Florence R
Bought by
Quality Choice Homes Inc
Home Financials for this Owner
Home Financials are based on the most recent Mortgage that was taken out on this home.
Original Mortgage
$77,600
Interest Rate
7%
Create a Home Valuation Report for This Property
The Home Valuation Report is an in-depth analysis detailing your home's value as well as a comparison with similar homes in the area
Home Values in the Area
Average Home Value in this Area
Purchase History
| Date | Buyer | Sale Price | Title Company |
|---|---|---|---|
| Powell Donald R | $194,500 | Fidelity National Title | |
| Tjan Anita G | $107,100 | Charter Title Corp | |
| Quality Choice Homes Inc | $30,000 | Chicago Title Insurance Co |
Source: Public Records
Mortgage History
| Date | Status | Borrower | Loan Amount |
|---|---|---|---|
| Closed | Powell Donald R | $29,175 | |
| Open | Powell Donald R | $155,600 | |
| Previous Owner | Tjan Anita G | $85,650 | |
| Previous Owner | Quality Choice Homes Inc | $77,600 |
Source: Public Records
Tax History Compared to Growth
Tax History
| Year | Tax Paid | Tax Assessment Tax Assessment Total Assessment is a certain percentage of the fair market value that is determined by local assessors to be the total taxable value of land and additions on the property. | Land | Improvement |
|---|---|---|---|---|
| 2025 | $3,623 | $292,828 | $114,574 | $178,254 |
| 2024 | $3,306 | $379,686 | $178,735 | $200,951 |
| 2023 | $3,577 | $372,300 | $174,152 | $198,148 |
| 2022 | $3,300 | $383,244 | $174,152 | $209,092 |
| 2021 | $3,349 | $295,581 | $135,197 | $160,384 |
| 2020 | $3,289 | $278,145 | $126,031 | $152,114 |
| 2019 | $2,888 | $253,286 | $114,574 | $138,712 |
| 2018 | $2,825 | $236,886 | $0 | $0 |
| 2017 | $2,466 | $194,800 | $0 | $0 |
| 2016 | $2,116 | $185,134 | $0 | $0 |
| 2015 | $1,980 | $158,055 | $0 | $0 |
| 2014 | -- | $139,396 | $0 | $0 |
| 2013 | -- | $126,759 | $0 | $0 |
Source: Public Records
Map
Nearby Homes
- 802 NW 5th Cir Unit 802
- 634 NW 5th Ave
- 907 NW Greeley St
- 912 NW Fargo St
- 715 NW 10th Ave
- 615 NW 7th Ave
- 541 NW 8th Ave
- 1945 NW 7th Ave
- 535 NW 9th Ave
- 527 NW 9th Ave
- 536 NW 10th Ave
- 1938 NW Sierra Ln
- 2012 NW Sierra Ln
- 2229 NW 6th Place
- 1123 NW Ash St
- 441 NW 15th Ave
- 2311 SW 6th Ave
- 2311 SW 6th Ave Unit D2
- 2311 SW 6th Ave Unit 9
- 2311 SW 6th Ave Unit 8B
- 605 NW Logan St
- 1310 NW Maple Ln
- 1316 NW Maple Ln
- 1318 NW Maple Ln
- 1315 NW Maple Ln
- 1320 NW Maple Ln Unit A
- 1320 NW Maple Ln Unit B
- 1320 NW Maple Ln
- 1230 NW 7th Ave
- 637 NW Logan St
- 664 NW Norwood St
- 1330 NW 7th Ave
- 1322 NW Maple Ln
- 660 NW Norwood St
- 1341 NW Maple Ln
- 0 NW Maple Ln
- 1340 NW Maple Ln
- 670 NW Norwood St
- 1235 NW 5th Ave
- 1221 NW 5th Ave