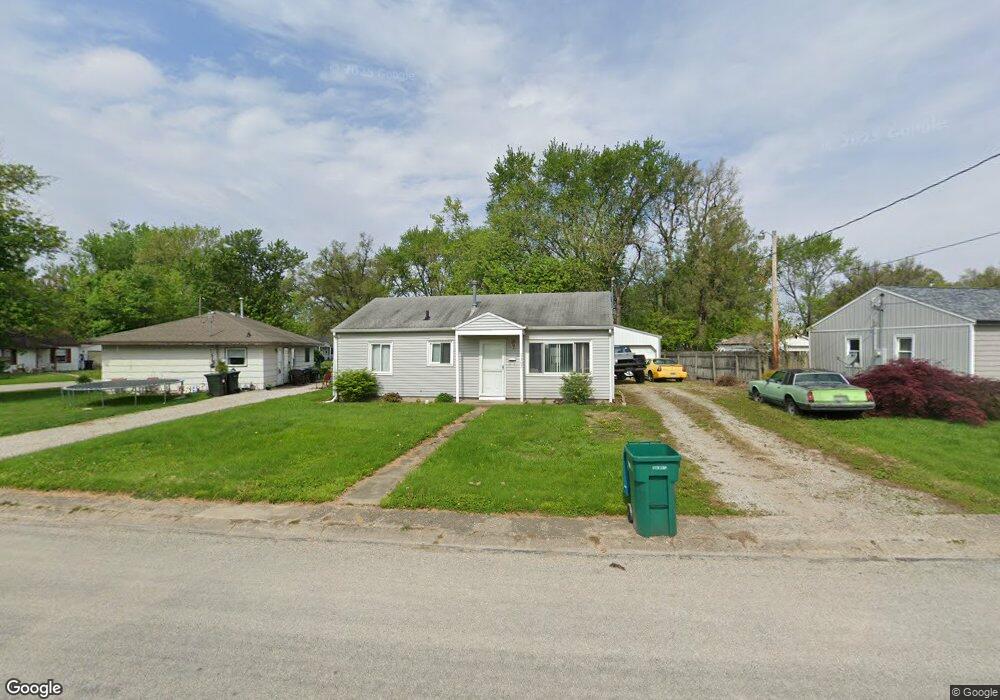
1307 S 4th St Mattoon, IL 61938
Estimated Value: $78,000 - $99,000
3
Beds
1
Bath
900
Sq Ft
$101/Sq Ft
Est. Value
About This Home
This home is located at 1307 S 4th St, Mattoon, IL 61938 and is currently estimated at $90,891, approximately $100 per square foot. 1307 S 4th St is a home located in Coles County with nearby schools including Mattoon High School, St. John's Lutheran School, and St Mary School.
Ownership History
Date
Name
Owned For
Owner Type
Purchase Details
Closed on
Sep 9, 2009
Sold by
Mtg Finance Llc
Bought by
Crary Davika Dannielle
Current Estimated Value
Home Financials for this Owner
Home Financials are based on the most recent Mortgage that was taken out on this home.
Original Mortgage
$44,800
Outstanding Balance
$29,239
Interest Rate
5.15%
Mortgage Type
New Conventional
Estimated Equity
$61,652
Purchase Details
Closed on
Jul 7, 2009
Sold by
Jean James F
Bought by
Mtg Finance Llc
Purchase Details
Closed on
Jun 8, 2005
Sold by
Reardon Natalie N and Denton Rodney K
Bought by
Jean James F
Home Financials for this Owner
Home Financials are based on the most recent Mortgage that was taken out on this home.
Original Mortgage
$53,490
Interest Rate
5.91%
Mortgage Type
FHA
Create a Home Valuation Report for This Property
The Home Valuation Report is an in-depth analysis detailing your home's value as well as a comparison with similar homes in the area
Home Values in the Area
Average Home Value in this Area
Purchase History
| Date | Buyer | Sale Price | Title Company |
|---|---|---|---|
| Crary Davika Dannielle | $42,500 | None Available | |
| Mtg Finance Llc | $33,015 | None Available | |
| Jean James F | $54,000 | None Available |
Source: Public Records
Mortgage History
| Date | Status | Borrower | Loan Amount |
|---|---|---|---|
| Open | Crary Davika Dannielle | $44,800 | |
| Previous Owner | Jean James F | $53,490 |
Source: Public Records
Tax History
| Year | Tax Paid | Tax Assessment Tax Assessment Total Assessment is a certain percentage of the fair market value that is determined by local assessors to be the total taxable value of land and additions on the property. | Land | Improvement |
|---|---|---|---|---|
| 2024 | $1,821 | $27,124 | $2,078 | $25,046 |
| 2023 | $1,643 | $24,436 | $1,872 | $22,564 |
| 2022 | $1,592 | $24,032 | $1,841 | $22,191 |
| 2021 | $1,532 | $21,651 | $1,659 | $19,992 |
| 2020 | $1,511 | $22,432 | $3,169 | $19,263 |
| 2019 | $1,465 | $21,651 | $3,059 | $18,592 |
| 2018 | $1,440 | $21,651 | $3,059 | $18,592 |
| 2017 | $1,437 | $21,651 | $3,059 | $18,592 |
| 2016 | $1,406 | $21,651 | $3,059 | $18,592 |
| 2015 | $1,358 | $21,226 | $2,999 | $18,227 |
| 2014 | $1,358 | $21,226 | $2,999 | $18,227 |
| 2013 | $1,358 | $21,226 | $2,999 | $18,227 |
Source: Public Records
Map
Nearby Homes
- LOT 37 Broadmoor Edgewater
- 1412 S 2nd St
- 1012 S 6th St
- 22 Elm Ridge
- 1117 Stinson Ave
- 601 Marshall Ave
- 1416 S Lawn Dr
- 609 Wabash Ave
- 1101 Wabash Ave
- 1312 Edgar Ave
- 7 Mitchell Ave
- 1301 Lafayette Ave
- 1509 Lafayette Ave
- 421 Dewitt Ave
- 24 S Country Club Rd
- 21 Cambridge
- 5 Greenbriar Dr Unit 1
- 20 Cambridge
- 1612 Richmond Ave
- 1112 Moultrie Ave
Your Personal Tour Guide
Ask me questions while you tour the home.