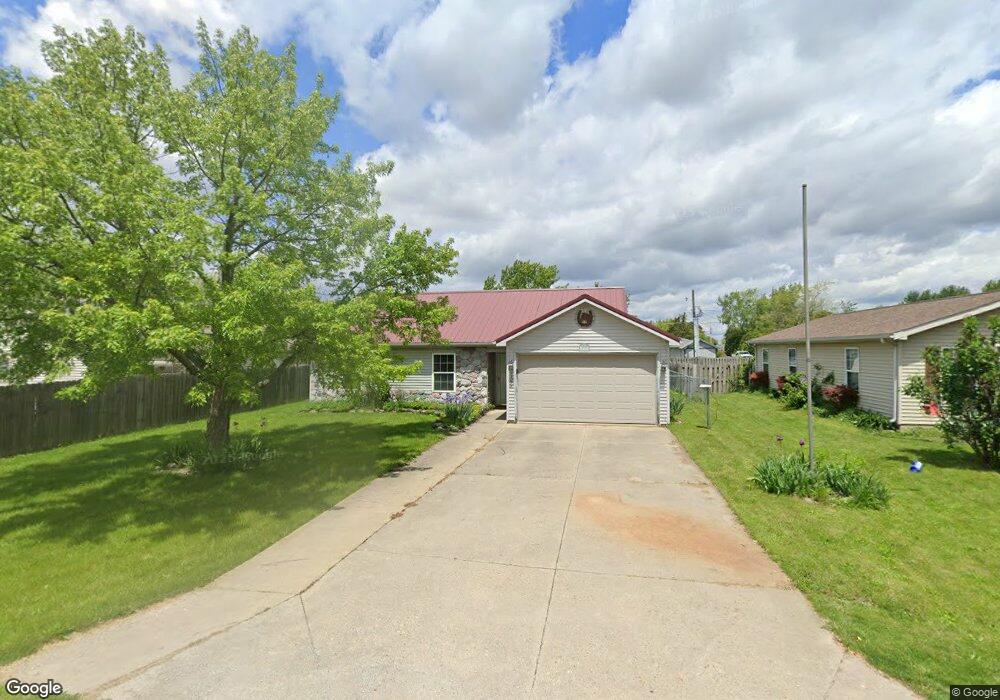
13071 Nancy St Paulding, OH 45879
Estimated Value: $127,822 - $143,000
3
Beds
1
Bath
1,004
Sq Ft
$135/Sq Ft
Est. Value
About This Home
This home is located at 13071 Nancy St, Paulding, OH 45879 and is currently estimated at $135,956, approximately $135 per square foot. 13071 Nancy St is a home located in Paulding County with nearby schools including Paulding High School.
Ownership History
Date
Name
Owned For
Owner Type
Purchase Details
Closed on
Oct 6, 2022
Sold by
Taylor Renee L
Bought by
Odonnell Aaron P
Current Estimated Value
Home Financials for this Owner
Home Financials are based on the most recent Mortgage that was taken out on this home.
Original Mortgage
$84,000
Outstanding Balance
$75,598
Interest Rate
5.55%
Mortgage Type
New Conventional
Estimated Equity
$60,358
Purchase Details
Closed on
May 22, 2007
Sold by
Lehman Daniel J and Lehman Laurel A
Bought by
Taylor Jim L and Taylor Renee L
Home Financials for this Owner
Home Financials are based on the most recent Mortgage that was taken out on this home.
Original Mortgage
$44,000
Interest Rate
6.21%
Mortgage Type
New Conventional
Purchase Details
Closed on
Dec 20, 2001
Sold by
Bowers Richard C
Bought by
Taylor Jim L Taylor Renee L
Purchase Details
Closed on
Oct 18, 2001
Sold by
Brighton Ernest J
Bought by
Taylor Jim L Taylor Renee L
Purchase Details
Closed on
Dec 3, 1999
Bought by
Taylor Jim L Taylor Renee L
Create a Home Valuation Report for This Property
The Home Valuation Report is an in-depth analysis detailing your home's value as well as a comparison with similar homes in the area
Home Values in the Area
Average Home Value in this Area
Purchase History
| Date | Buyer | Sale Price | Title Company |
|---|---|---|---|
| Odonnell Aaron P | $26,250 | -- | |
| Taylor Jim L | $69,000 | None Available | |
| Taylor Jim L Taylor Renee L | $55,000 | -- | |
| Taylor Jim L Taylor Renee L | $44,000 | -- | |
| Taylor Jim L Taylor Renee L | -- | -- |
Source: Public Records
Mortgage History
| Date | Status | Borrower | Loan Amount |
|---|---|---|---|
| Open | Odonnell Aaron P | $84,000 | |
| Previous Owner | Taylor Jim L | $44,000 |
Source: Public Records
Tax History
| Year | Tax Paid | Tax Assessment Tax Assessment Total Assessment is a certain percentage of the fair market value that is determined by local assessors to be the total taxable value of land and additions on the property. | Land | Improvement |
|---|---|---|---|---|
| 2025 | $1,751 | $40,460 | $5,670 | $34,790 |
| 2024 | $1,751 | $29,960 | $4,200 | $25,760 |
| 2023 | $1,347 | $29,960 | $4,200 | $25,760 |
| 2022 | $939 | $29,960 | $4,200 | $25,760 |
| 2021 | $680 | $22,540 | $3,780 | $18,760 |
| 2020 | $608 | $22,540 | $3,780 | $18,760 |
| 2019 | $613 | $21,630 | $3,780 | $17,850 |
| 2018 | $997 | $21,630 | $3,780 | $17,850 |
| 2017 | $1,023 | $21,630 | $3,780 | $17,850 |
| 2016 | $1,003 | $21,630 | $3,780 | $17,850 |
| 2015 | $1,039 | $22,720 | $3,780 | $18,940 |
| 2014 | $1,034 | $22,720 | $3,780 | $18,940 |
| 2013 | $1,119 | $22,720 | $3,780 | $18,940 |
Source: Public Records
Map
Nearby Homes
- 1065 Emerald Rd
- 13688 Kay St
- 741 Tom Tim Dr
- 830 N Walnut St
- 780 N Williams St
- 516 N Williams St
- 301 N Main St
- 406 N Cherry St
- 701 E Wayne St
- 215 N Dewitt St
- 614 W Jackson St
- 780 W Jackson St
- 742 E Perry St
- 520 W Wayne St
- 717 W Harrison St
- 714 W Wayne St
- 15010 U S 127
- 11051 Road 93
- 225 2nd St
- 17341 Road 139
- 13113 Nancy St
- 12306 Robert St
- 13018 Nancy St
- 13155 Nancy St
- 13134 Nancy St
- 13090 Nancy St
- 13176 Nancy St
- 13064 Rita St
- 12215 Robert St
- 12277 Robert St
- 12335 Robert St
- 13220 Nancy St
- 13249 Nancy St
- 12407 Robert St
- 13112 Rita St
- 12151 Robert St
- 13355 Helen St
- 13264 Nancy St
- 13166 Rita St
- 13291 Nancy St
Your Personal Tour Guide
Ask me questions while you tour the home.