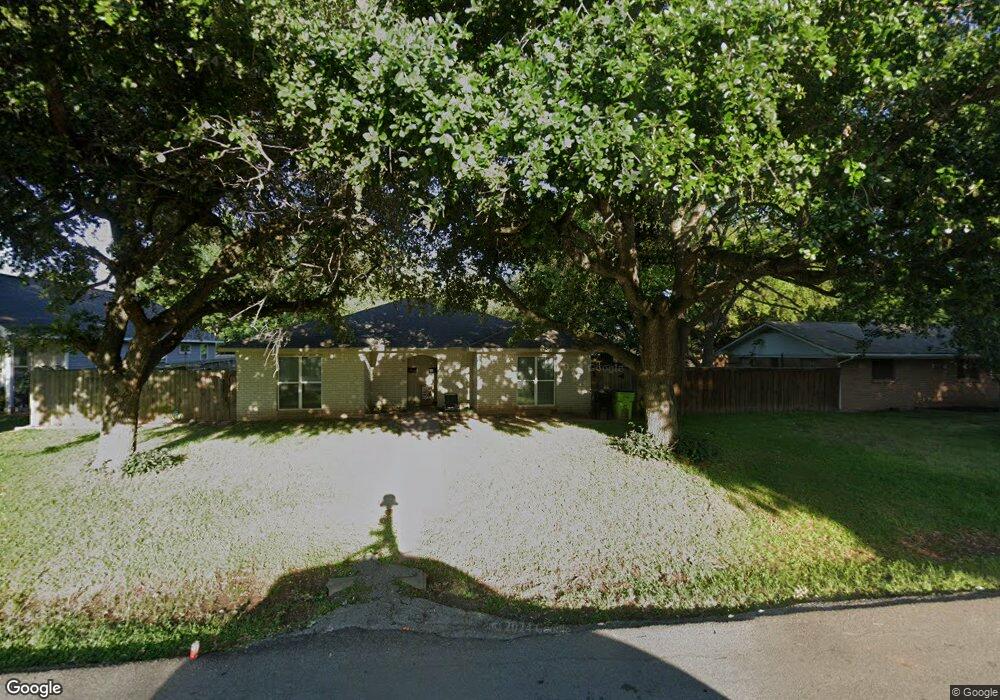
1308 8th St Rosenberg, TX 77471
Estimated Value: $185,007 - $264,000
2
Beds
2
Baths
1,751
Sq Ft
$137/Sq Ft
Est. Value
About This Home
This home is located at 1308 8th St, Rosenberg, TX 77471 and is currently estimated at $240,252, approximately $137 per square foot. 1308 8th St is a home located in Fort Bend County with nearby schools including Travis Elementary School, Navarro Middle School, and George Junior High School.
Ownership History
Date
Name
Owned For
Owner Type
Purchase Details
Closed on
Jan 3, 2020
Sold by
Tkc Real Estate Investments Llc
Bought by
Fall 91 Holdings Llc
Current Estimated Value
Home Financials for this Owner
Home Financials are based on the most recent Mortgage that was taken out on this home.
Original Mortgage
$101,550
Outstanding Balance
$69,445
Interest Rate
3.6%
Mortgage Type
New Conventional
Estimated Equity
$170,807
Create a Home Valuation Report for This Property
The Home Valuation Report is an in-depth analysis detailing your home's value as well as a comparison with similar homes in the area
Home Values in the Area
Average Home Value in this Area
Purchase History
| Date | Buyer | Sale Price | Title Company |
|---|---|---|---|
| Fall 91 Holdings Llc | -- | Stewart Title |
Source: Public Records
Mortgage History
| Date | Status | Borrower | Loan Amount |
|---|---|---|---|
| Open | Fall 91 Holdings Llc | $101,550 |
Source: Public Records
Tax History Compared to Growth
Tax History
| Year | Tax Paid | Tax Assessment Tax Assessment Total Assessment is a certain percentage of the fair market value that is determined by local assessors to be the total taxable value of land and additions on the property. | Land | Improvement |
|---|---|---|---|---|
| 2025 | $2,904 | $136,396 | $76,106 | $60,290 |
| 2024 | $2,904 | $153,728 | $76,106 | $77,622 |
| 2023 | $2,782 | $144,100 | $59,210 | $84,890 |
| 2022 | $3,473 | $169,580 | $59,210 | $110,370 |
| 2021 | $3,000 | $144,590 | $53,710 | $90,880 |
| 2020 | $2,367 | $111,530 | $53,000 | $58,530 |
| 2019 | $2,547 | $111,530 | $31,880 | $79,650 |
| 2018 | $2,346 | $101,080 | $31,880 | $69,200 |
| 2017 | $2,180 | $93,410 | $31,880 | $61,530 |
| 2016 | $2,100 | $89,960 | $31,880 | $58,080 |
| 2015 | $2,072 | $88,300 | $31,880 | $56,420 |
| 2014 | $2,016 | $84,880 | $31,880 | $53,000 |
Source: Public Records
Map
Nearby Homes