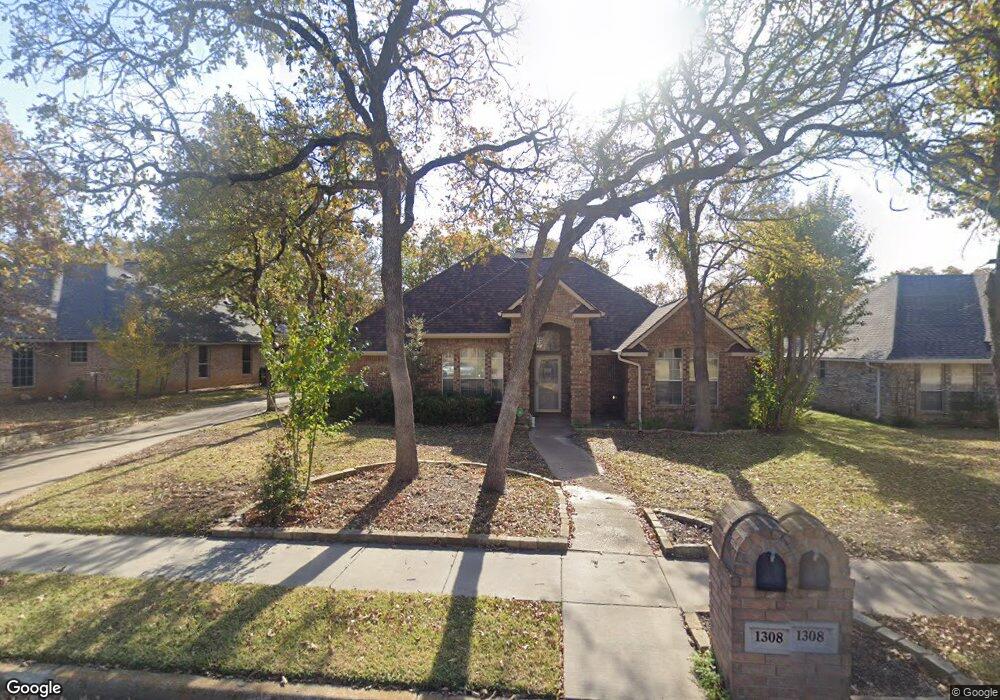
1308 Briar Dr Bedford, TX 76022
Estimated Value: $362,673 - $430,000
3
Beds
2
Baths
1,801
Sq Ft
$220/Sq Ft
Est. Value
About This Home
This home is located at 1308 Briar Dr, Bedford, TX 76022 and is currently estimated at $395,918, approximately $219 per square foot. 1308 Briar Dr is a home located in Tarrant County with nearby schools including Stonegate Elementary School, Central J High School, and L.D. Bell High School.
Ownership History
Date
Name
Owned For
Owner Type
Purchase Details
Closed on
Jan 26, 2004
Sold by
Thomas Chad
Bought by
Tompkins Ralph L and Tompkins Donna L
Current Estimated Value
Home Financials for this Owner
Home Financials are based on the most recent Mortgage that was taken out on this home.
Original Mortgage
$124,000
Outstanding Balance
$57,994
Interest Rate
5.79%
Mortgage Type
Purchase Money Mortgage
Estimated Equity
$337,924
Purchase Details
Closed on
Apr 10, 1998
Sold by
Olarte Guillermo and Olarte Ligia
Bought by
Thomas Chad
Home Financials for this Owner
Home Financials are based on the most recent Mortgage that was taken out on this home.
Original Mortgage
$114,285
Interest Rate
7.23%
Create a Home Valuation Report for This Property
The Home Valuation Report is an in-depth analysis detailing your home's value as well as a comparison with similar homes in the area
Home Values in the Area
Average Home Value in this Area
Purchase History
| Date | Buyer | Sale Price | Title Company |
|---|---|---|---|
| Tompkins Ralph L | -- | Commerce Title | |
| Thomas Chad | -- | Safeco Land Title |
Source: Public Records
Mortgage History
| Date | Status | Borrower | Loan Amount |
|---|---|---|---|
| Open | Tompkins Ralph L | $124,000 | |
| Previous Owner | Thomas Chad | $114,285 | |
| Closed | Tompkins Ralph L | $23,250 |
Source: Public Records
Tax History Compared to Growth
Tax History
| Year | Tax Paid | Tax Assessment Tax Assessment Total Assessment is a certain percentage of the fair market value that is determined by local assessors to be the total taxable value of land and additions on the property. | Land | Improvement |
|---|---|---|---|---|
| 2025 | $1,265 | $289,052 | $75,000 | $214,052 |
| 2024 | $1,265 | $332,171 | $75,000 | $257,171 |
| 2023 | $6,227 | $345,786 | $55,000 | $290,786 |
| 2022 | $6,446 | $304,543 | $55,000 | $249,543 |
| 2021 | $6,320 | $281,599 | $55,000 | $226,599 |
| 2020 | $5,799 | $243,907 | $55,000 | $188,907 |
| 2019 | $5,891 | $245,383 | $55,000 | $190,383 |
| 2018 | $2,674 | $220,458 | $35,000 | $185,458 |
| 2017 | $5,219 | $226,070 | $35,000 | $191,070 |
| 2016 | $4,745 | $204,337 | $35,000 | $169,337 |
| 2015 | $2,682 | $190,978 | $35,000 | $155,978 |
| 2014 | $2,682 | $162,100 | $28,000 | $134,100 |
Source: Public Records
Map
Nearby Homes
- 1213 Briar Dr
- 1204 Edgecliff Dr
- 1509 Shirley Way
- 1004 Overhill Dr
- 604 Donna Ln
- 1416 Wade Dr
- 921 Overhill Dr
- 1031 Boston Blvd
- 1108 Wade Dr
- 909 Overhill Dr
- 1701 Winchester Way
- 501 Merrill Dr
- 933 Wade Dr
- 49 Coffee Tavern Rd
- 1236 King Dr
- 904 Nelson Terrace
- 345 Somerset Cir
- 258 Somerset Terrace
- 1008 Russell Ln
- 1613 Trinity Ct