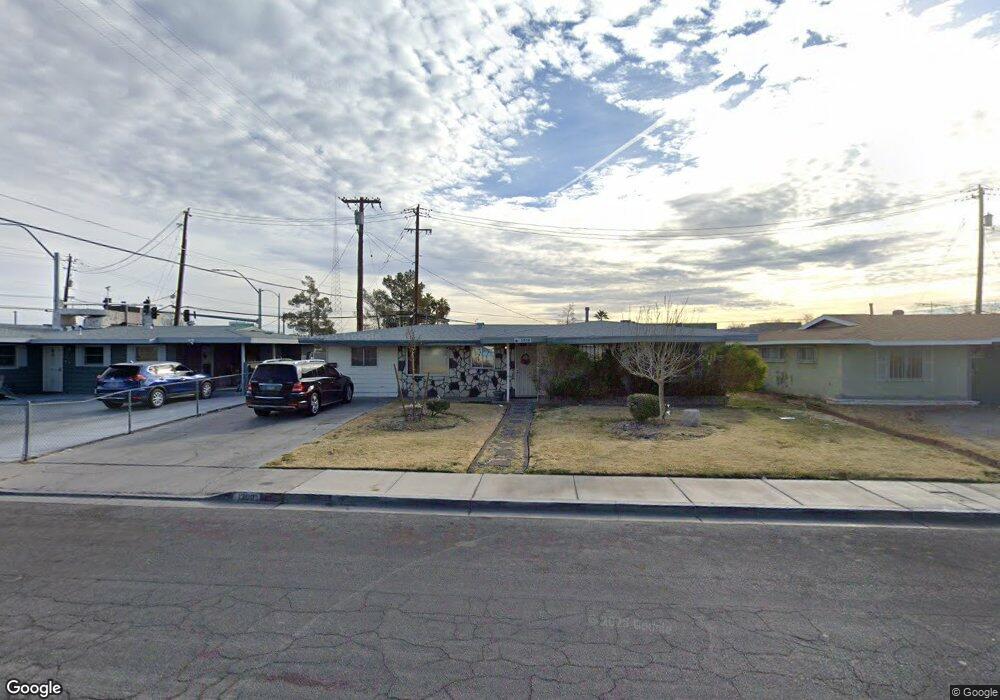
1308 Cherokee Ln Las Vegas, NV 89106
West Las Vegas NeighborhoodEstimated Value: $307,882 - $349,000
3
Beds
2
Baths
1,392
Sq Ft
$235/Sq Ft
Est. Value
About This Home
This home is located at 1308 Cherokee Ln, Las Vegas, NV 89106 and is currently estimated at $327,721, approximately $235 per square foot. 1308 Cherokee Ln is a home located in Clark County with nearby schools including Ollie Detwiler Elementary School, West Prepatory Academy At Charlles I West Hall Sec, and Western High School.
Ownership History
Date
Name
Owned For
Owner Type
Purchase Details
Closed on
Sep 19, 2000
Sold by
Fn Investments Inc
Bought by
Mckoin Ruth J
Current Estimated Value
Home Financials for this Owner
Home Financials are based on the most recent Mortgage that was taken out on this home.
Original Mortgage
$100,630
Outstanding Balance
$36,364
Interest Rate
7.98%
Mortgage Type
FHA
Estimated Equity
$291,357
Purchase Details
Closed on
Jul 17, 2000
Sold by
Hud
Bought by
Fn Investments Inc
Purchase Details
Closed on
Jun 2, 1999
Sold by
Chase Manhattan Company
Bought by
Hud
Purchase Details
Closed on
Jan 21, 1994
Sold by
Johnson Roosevelt
Bought by
Johnson Roosevelt
Home Financials for this Owner
Home Financials are based on the most recent Mortgage that was taken out on this home.
Original Mortgage
$70,709
Interest Rate
7.21%
Mortgage Type
FHA
Create a Home Valuation Report for This Property
The Home Valuation Report is an in-depth analysis detailing your home's value as well as a comparison with similar homes in the area
Home Values in the Area
Average Home Value in this Area
Purchase History
| Date | Buyer | Sale Price | Title Company |
|---|---|---|---|
| Mckoin Ruth J | $102,000 | Stewart Title | |
| Fn Investments Inc | $67,350 | Stewart Title | |
| Hud | -- | Land Title | |
| Chase Mtg Company | $78,132 | Land Title | |
| Johnson Roosevelt | -- | Land Title |
Source: Public Records
Mortgage History
| Date | Status | Borrower | Loan Amount |
|---|---|---|---|
| Open | Mckoin Ruth J | $100,630 | |
| Previous Owner | Johnson Roosevelt | $70,709 | |
| Closed | Mckoin Ruth J | $3,100 |
Source: Public Records
Tax History Compared to Growth
Tax History
| Year | Tax Paid | Tax Assessment Tax Assessment Total Assessment is a certain percentage of the fair market value that is determined by local assessors to be the total taxable value of land and additions on the property. | Land | Improvement |
|---|---|---|---|---|
| 2025 | $626 | $47,246 | $29,050 | $18,196 |
| 2024 | $608 | $47,246 | $29,050 | $18,196 |
| 2023 | $608 | $47,539 | $31,150 | $16,389 |
| 2022 | $591 | $38,434 | $23,800 | $14,634 |
| 2021 | $573 | $36,385 | $22,750 | $13,635 |
| 2020 | $554 | $31,789 | $18,550 | $13,239 |
| 2019 | $538 | $27,143 | $14,350 | $12,793 |
| 2018 | $522 | $24,205 | $12,250 | $11,955 |
| 2017 | $744 | $22,694 | $10,850 | $11,844 |
| 2016 | $496 | $20,186 | $8,750 | $11,436 |
| 2015 | $493 | $16,343 | $5,250 | $11,093 |
| 2014 | $479 | $14,175 | $3,500 | $10,675 |
Source: Public Records
Map
Nearby Homes
- 1204 Arrowhead Ave
- 1700 Ferrell St
- 1106 Arrowhead Ave
- 1604 Luning Dr
- 2624 Feather Cactus Ct
- 1225 Arrowhead Ave
- 1103 Arrowhead Ave
- 2508 Ellingson Dr
- 2520 Bottle Palm Ct
- 1920 Hodgenville St Unit 103
- 2621 Adelante Ave Unit 104
- 2621 Adelante Ave Unit 102
- 3017 Holly Ave
- 2632 Chin Cactus Ct
- 1901 Manhattan Dr
- 2525 Sierra Bello Ave Unit 103
- 3494 Alpheus River Ave
- 2521 Rainbow Cactus Ct
- 2625 Chin Cactus Ct
- 3541 Arcadian Sea St
- 1306 Cherokee Ln
- 1310 Cherokee Ln
- 2597 Vegas Dr
- 1304 Cherokee Ln
- 1309 Cherokee Ln
- 1307 Cherokee Ln
- 1311 Cherokee Ln
- 1305 Cherokee Ln
- 1505 Exodus Ct
- 1509 Exodus Ct
- 1513 Exodus Ct
- 1303 Cherokee Ln
- 1501 Exodus Ct
- 1310 Riverside Dr
- 1300 Cherokee Ln
- 1312 Riverside Dr
- 1308 Riverside Dr
- 1306 Riverside Dr
- 1301 Cherokee Ln
- 1216 Cherokee Ln