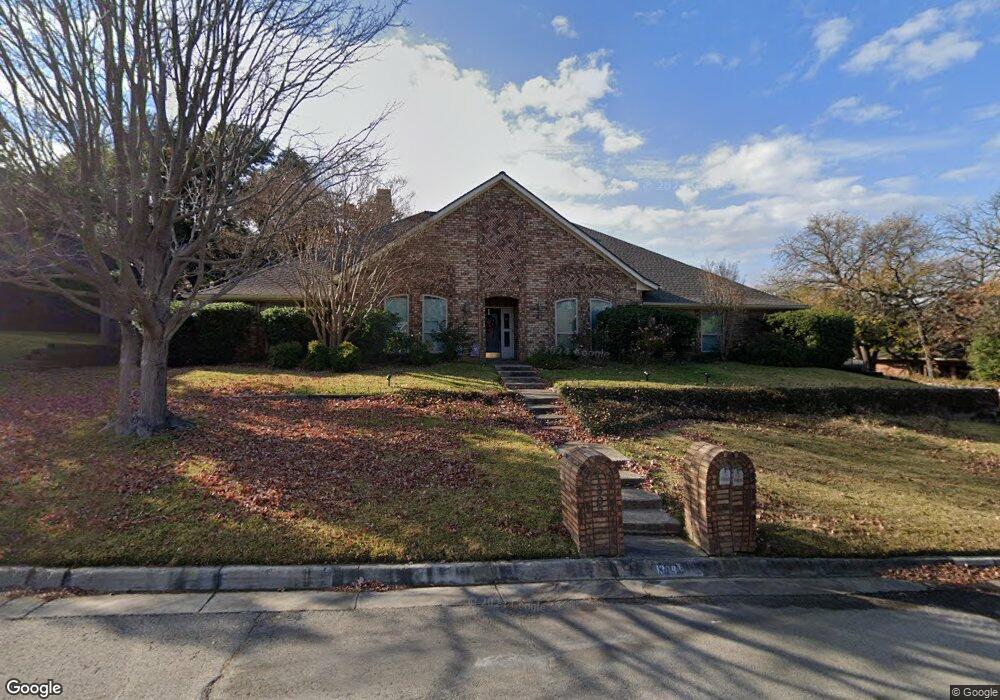
1308 Crest Dr Colleyville, TX 76034
Estimated Value: $698,834 - $746,000
4
Beds
3
Baths
3,166
Sq Ft
$229/Sq Ft
Est. Value
About This Home
This home is located at 1308 Crest Dr, Colleyville, TX 76034 and is currently estimated at $724,459, approximately $228 per square foot. 1308 Crest Dr is a home located in Tarrant County with nearby schools including Bedford Heights Elementary School, Bedford Junior High School, and L.D. Bell High School.
Ownership History
Date
Name
Owned For
Owner Type
Purchase Details
Closed on
Oct 11, 2002
Sold by
Vowell Larry K and Vowell Brenda C
Bought by
Cassidy Douglas P and Cassidy Heather M
Current Estimated Value
Home Financials for this Owner
Home Financials are based on the most recent Mortgage that was taken out on this home.
Original Mortgage
$200,000
Interest Rate
6.2%
Purchase Details
Closed on
May 21, 1999
Sold by
Lowry William E and Lowry Debbie L
Bought by
Vowell Larry K and Vowell Brenda C
Home Financials for this Owner
Home Financials are based on the most recent Mortgage that was taken out on this home.
Original Mortgage
$184,000
Interest Rate
6.92%
Purchase Details
Closed on
May 6, 1996
Sold by
Pfiester Don C and Pfiester Karen B
Bought by
Lowry William E and Lowry Debbie L
Home Financials for this Owner
Home Financials are based on the most recent Mortgage that was taken out on this home.
Original Mortgage
$180,000
Interest Rate
7.67%
Create a Home Valuation Report for This Property
The Home Valuation Report is an in-depth analysis detailing your home's value as well as a comparison with similar homes in the area
Home Values in the Area
Average Home Value in this Area
Purchase History
| Date | Buyer | Sale Price | Title Company |
|---|---|---|---|
| Cassidy Douglas P | -- | American Title Co | |
| Vowell Larry K | -- | First American Title Co | |
| Lowry William E | -- | Trinity Western Title Co |
Source: Public Records
Mortgage History
| Date | Status | Borrower | Loan Amount |
|---|---|---|---|
| Closed | Cassidy Douglas P | $200,000 | |
| Previous Owner | Vowell Larry K | $184,000 | |
| Previous Owner | Lowry William E | $180,000 |
Source: Public Records
Tax History Compared to Growth
Tax History
| Year | Tax Paid | Tax Assessment Tax Assessment Total Assessment is a certain percentage of the fair market value that is determined by local assessors to be the total taxable value of land and additions on the property. | Land | Improvement |
|---|---|---|---|---|
| 2025 | $6,215 | $546,500 | $174,800 | $371,700 |
| 2024 | $6,215 | $552,000 | $174,800 | $377,200 |
| 2023 | $8,045 | $540,000 | $174,800 | $365,200 |
| 2022 | $8,490 | $482,000 | $174,800 | $307,200 |
| 2021 | $8,259 | $395,000 | $104,880 | $290,120 |
| 2020 | $8,356 | $395,000 | $104,880 | $290,120 |
| 2019 | $8,644 | $395,000 | $104,880 | $290,120 |
| 2018 | $6,565 | $372,000 | $104,880 | $267,120 |
| 2017 | $8,214 | $360,000 | $80,000 | $280,000 |
| 2016 | $8,627 | $385,000 | $80,000 | $305,000 |
| 2015 | $7,405 | $343,700 | $50,000 | $293,700 |
| 2014 | $7,405 | $343,700 | $50,000 | $293,700 |
Source: Public Records
Map
Nearby Homes
- 1303 Crest Dr
- 1421 Plantation Dr N
- 3907 Copperwood Ct
- 4002 Copperwood Ct
- 1136 Wingate Dr
- 3907 Windermere Dr
- 4105 Inwood Ln
- 4600 Stafford Dr
- 3827 Ashbury Ln
- 2001 Oak Knoll Dr
- 4516 Dartmoore Ln
- 1109 Simpson Terrace
- 4600 Westbury Dr
- 1209 Hillandale Ct
- 4812 Carmel Place
- 909 Brestol Ct W
- 2204 Woodstock Dr
- 3624 Wayne Ct
- 1820 Wimbleton Dr
- 3301 Wendover Ct
- 1310 Crest Dr
- 1306 Crest Dr
- 4002 Fair Hill Ct
- 1315 Crest Dr
- 1313 Crest Dr
- 1304 Crest Dr
- 1312 Crest Dr
- 4000 Fair Hill Ct
- 4004 Fair Hill Ct
- 1411 Plantation Dr N
- 1311 Crest Dr
- 1302 Crest Dr
- 4003 Fair Hill Ct
- 1415 Plantation Dr N
- 1309 Crest Dr
- 1417 Plantation Dr N
- 4001 Fair Hill Ct
- 1300 Crest Dr
- 1419 Plantation Dr N
- 4101 Wood Creek Ct