1308 Dean Dr Waycross, GA 31501
Estimated Value: $159,000 - $173,000
3
Beds
2
Baths
1,474
Sq Ft
$112/Sq Ft
Est. Value
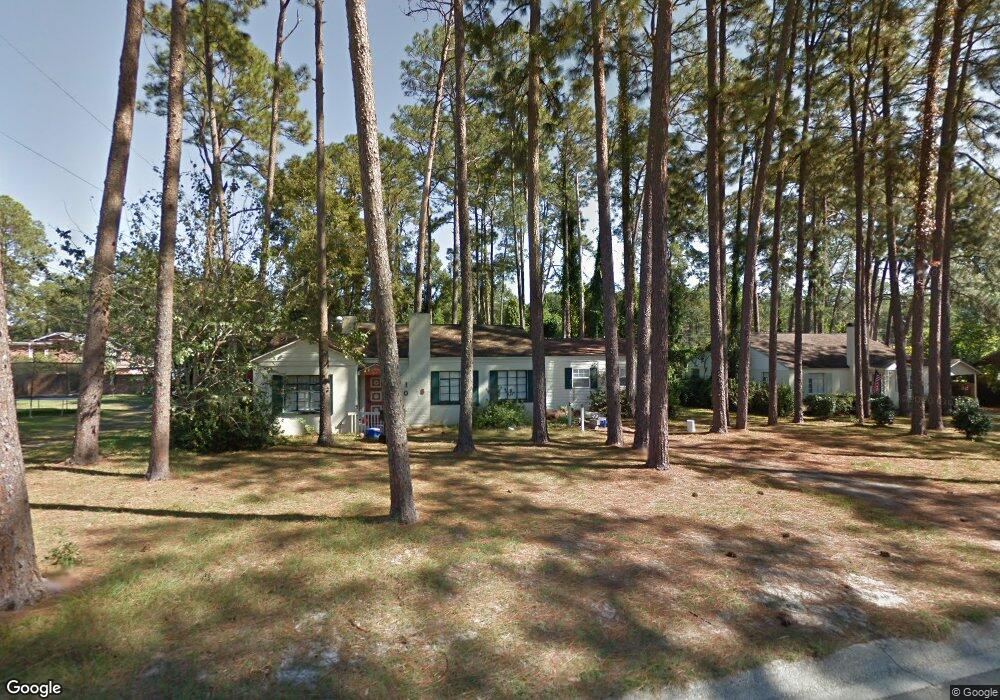
About This Home
This home is located at 1308 Dean Dr, Waycross, GA 31501 and is currently estimated at $164,808, approximately $111 per square foot. 1308 Dean Dr is a home located in Ware County with nearby schools including Williams Heights Elementary School, Waycross Middle School, and Ware County High School.
Ownership History
Date
Name
Owned For
Owner Type
Purchase Details
Closed on
Mar 1, 2023
Sold by
Stafford Lisa
Bought by
Richardson Ian
Current Estimated Value
Home Financials for this Owner
Home Financials are based on the most recent Mortgage that was taken out on this home.
Original Mortgage
$153,450
Outstanding Balance
$148,598
Interest Rate
6.09%
Mortgage Type
VA
Estimated Equity
$16,210
Purchase Details
Closed on
May 4, 2005
Sold by
Bennett Georgia Nancy
Bought by
Ali Mohammed W
Purchase Details
Closed on
Jan 7, 2005
Sold by
Griffis Billy
Bought by
Meeks Terri R
Home Financials for this Owner
Home Financials are based on the most recent Mortgage that was taken out on this home.
Original Mortgage
$82,000
Interest Rate
5.61%
Mortgage Type
New Conventional
Purchase Details
Closed on
Feb 20, 2004
Sold by
Baisden Grace
Bought by
Griffis Billy
Purchase Details
Closed on
Nov 20, 2000
Sold by
Trust Co Bank Of Sooutheast
Bought by
Baisden Grace
Create a Home Valuation Report for This Property
The Home Valuation Report is an in-depth analysis detailing your home's value as well as a comparison with similar homes in the area
Home Values in the Area
Average Home Value in this Area
Purchase History
| Date | Buyer | Sale Price | Title Company |
|---|---|---|---|
| Richardson Ian | $150,000 | -- | |
| Ali Mohammed W | $13,000 | -- | |
| Meeks Terri R | $82,500 | -- | |
| Griffis Billy | $42,000 | -- | |
| Baisden Grace | $29,200 | -- |
Source: Public Records
Mortgage History
| Date | Status | Borrower | Loan Amount |
|---|---|---|---|
| Open | Richardson Ian | $153,450 | |
| Previous Owner | Meeks Terri R | $82,000 |
Source: Public Records
Tax History Compared to Growth
Tax History
| Year | Tax Paid | Tax Assessment Tax Assessment Total Assessment is a certain percentage of the fair market value that is determined by local assessors to be the total taxable value of land and additions on the property. | Land | Improvement |
|---|---|---|---|---|
| 2024 | $1,710 | $50,621 | $8,960 | $41,661 |
| 2023 | $1,746 | $19,279 | $6,845 | $12,434 |
| 2022 | $931 | $23,356 | $6,845 | $16,511 |
| 2021 | $1,095 | $31,264 | $6,845 | $24,419 |
| 2020 | $1,103 | $30,043 | $6,845 | $23,198 |
| 2019 | $1,111 | $28,212 | $6,845 | $21,367 |
| 2018 | $1,099 | $27,449 | $6,845 | $20,604 |
| 2017 | $1,084 | $27,449 | $6,845 | $20,604 |
| 2016 | $1,084 | $27,905 | $6,845 | $21,060 |
| 2015 | $1,091 | $27,905 | $6,845 | $21,060 |
| 2014 | $1,090 | $27,905 | $6,845 | $21,060 |
| 2013 | -- | $29,298 | $6,845 | $22,453 |
Source: Public Records
Map
Nearby Homes
- 1205 Dean Dr
- 1100 Euclid Ave
- 1002 Baltimore Ave
- 1009 Euclid Ave
- 907 Euclid Ave
- 1100 Atlantic Ave
- 1001 Coral Rd
- 903 Atlantic Ave
- 1204 Richmond Ave
- 0 Saint Marys Dr Unit (TRACT 2 0.25 ACRES)
- 1500 Saint Marys Dr
- 00 Seminole Trail
- 707 Euclid Ave
- 807 City Blvd
- 713 Magnolia Dr
- 1400 E Cherokee Dr
- 1002 Cherokee Cir
- 1011 Cherokee Cir
- Lot 3 City Blvd
- 706 Cherokee Cir