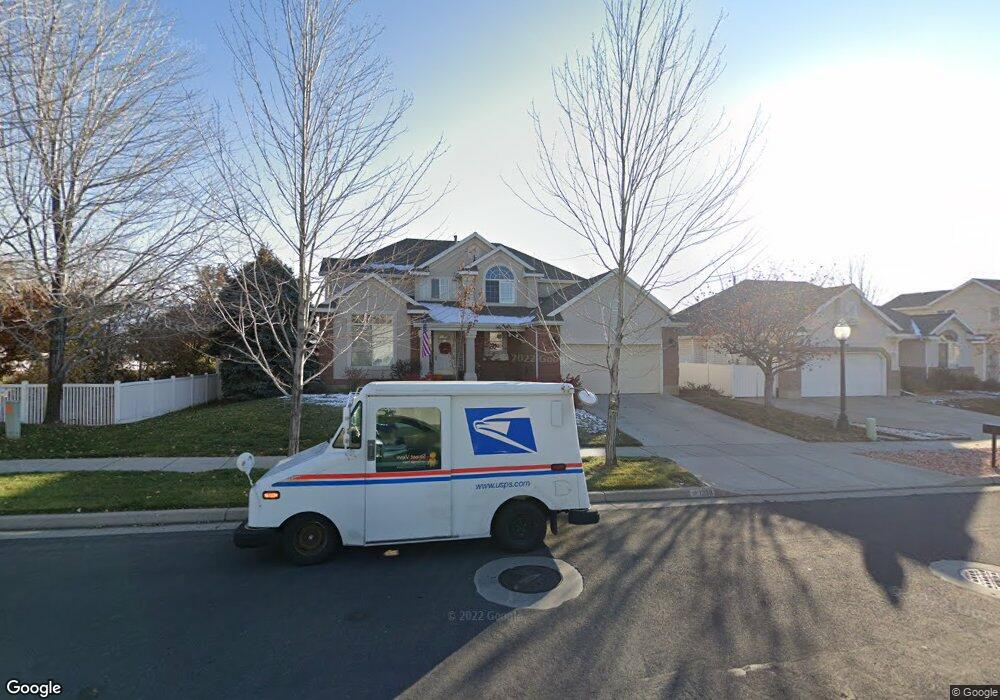
1308 E 2675 N Layton, UT 84040
Estimated Value: $621,000 - $671,000
4
Beds
3
Baths
3,943
Sq Ft
$166/Sq Ft
Est. Value
About This Home
This home is located at 1308 E 2675 N, Layton, UT 84040 and is currently estimated at $656,013, approximately $166 per square foot. 1308 E 2675 N is a home located in Davis County with nearby schools including Sarah Jane Adams Elementary School, North Layton Junior High School, and Northridge High School.
Ownership History
Date
Name
Owned For
Owner Type
Purchase Details
Closed on
Oct 27, 2014
Sold by
Kersten Peter C and Kersten Lynnette C
Bought by
Soltys Scott William and Soltys Mandee Lucene
Current Estimated Value
Home Financials for this Owner
Home Financials are based on the most recent Mortgage that was taken out on this home.
Original Mortgage
$239,320
Outstanding Balance
$184,146
Interest Rate
4.2%
Mortgage Type
New Conventional
Estimated Equity
$471,867
Purchase Details
Closed on
Apr 12, 2004
Sold by
Ivory Homes Ltd
Bought by
Kersten Peter C and Kersten Lynnette C
Home Financials for this Owner
Home Financials are based on the most recent Mortgage that was taken out on this home.
Original Mortgage
$222,400
Interest Rate
5.57%
Mortgage Type
Purchase Money Mortgage
Create a Home Valuation Report for This Property
The Home Valuation Report is an in-depth analysis detailing your home's value as well as a comparison with similar homes in the area
Home Values in the Area
Average Home Value in this Area
Purchase History
| Date | Buyer | Sale Price | Title Company |
|---|---|---|---|
| Soltys Scott William | -- | Us Title Company O | |
| Kersten Peter C | -- | Bonneville Title Company Inc |
Source: Public Records
Mortgage History
| Date | Status | Borrower | Loan Amount |
|---|---|---|---|
| Open | Soltys Scott William | $239,320 | |
| Previous Owner | Kersten Peter C | $222,400 | |
| Closed | Kersten Peter C | $27,800 |
Source: Public Records
Tax History
| Year | Tax Paid | Tax Assessment Tax Assessment Total Assessment is a certain percentage of the fair market value that is determined by local assessors to be the total taxable value of land and additions on the property. | Land | Improvement |
|---|---|---|---|---|
| 2025 | $3,353 | $325,600 | $121,001 | $204,599 |
| 2024 | $3,142 | $309,100 | $145,426 | $163,674 |
| 2023 | $3,144 | $551,000 | $197,425 | $353,575 |
| 2022 | $3,165 | $302,500 | $105,780 | $196,720 |
| 2021 | $2,922 | $416,000 | $160,798 | $255,202 |
| 2020 | $2,732 | $373,000 | $129,449 | $243,551 |
| 2019 | $2,599 | $349,000 | $115,799 | $233,201 |
| 2018 | $2,410 | $325,000 | $73,727 | $251,273 |
| 2016 | $2,290 | $162,085 | $36,236 | $125,849 |
| 2015 | $2,337 | $158,070 | $36,236 | $121,834 |
| 2014 | $2,083 | $144,498 | $36,236 | $108,262 |
| 2013 | -- | $162,512 | $43,025 | $119,487 |
Source: Public Records
Map
Nearby Homes
- 1292 E 2675 N
- 1447 E 2700 N
- 2798 N 1525 E
- 1123 E 2500 N
- 1444 E 2400 N
- 948 E Hercules Ct Unit 179
- 2529 N 1000 E
- 1731 E 2825 N
- 1266 E 3125 N
- 1120 E 2200 N
- 1099 E 2125 N
- 1505 E 3225 N
- 2096 N 1450 E
- 1935 Deere Valley Dr
- 935 E 3000 N Unit 175
- 935 E 3000 N Unit 165
- 935 E 3000 N Unit 26
- 935 E 3000 N Unit 90
- 935 E 3000 N Unit 27
- 935 E Highway 193 Unit 102