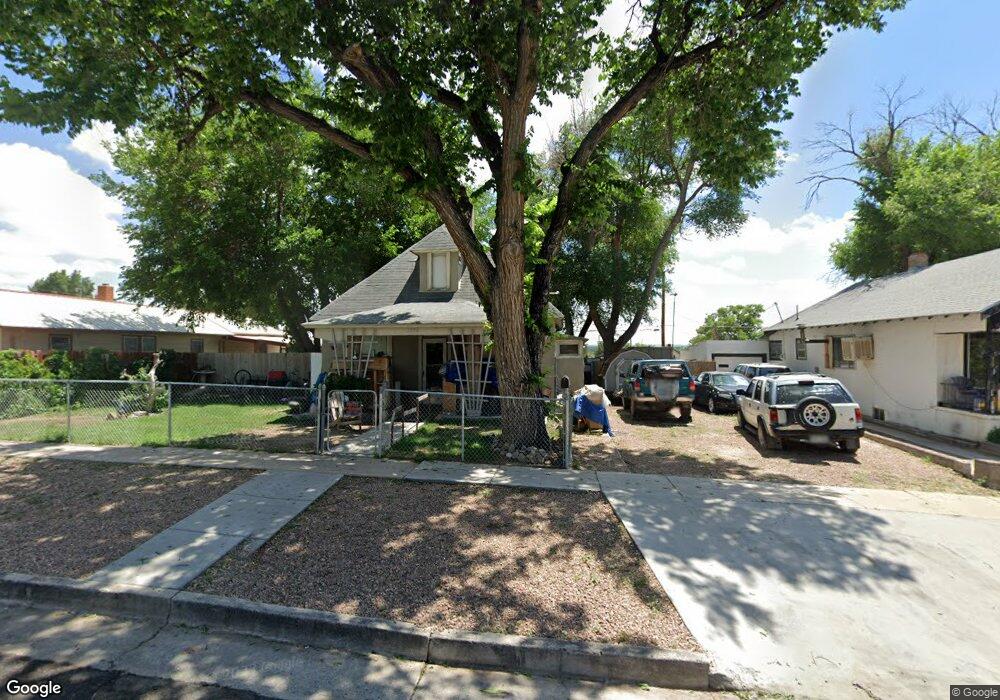
1308 E 3rd St Pueblo, CO 81001
Lower East Side NeighborhoodEstimated Value: $133,000 - $187,000
3
Beds
2
Baths
884
Sq Ft
$181/Sq Ft
Est. Value
About This Home
This home is located at 1308 E 3rd St, Pueblo, CO 81001 and is currently estimated at $159,580, approximately $180 per square foot. 1308 E 3rd St is a home located in Pueblo County with nearby schools including Bradford Elementary School, Risley International Academy of Innovation, and East High School.
Ownership History
Date
Name
Owned For
Owner Type
Purchase Details
Closed on
Aug 14, 2025
Sold by
Huren William Kolten and Hensley Leroy Edwin
Bought by
Hensley Leroy E
Current Estimated Value
Purchase Details
Closed on
Aug 28, 2023
Sold by
Hensley Leroy E
Bought by
Hensley Leroy E and Huren William Kolten
Purchase Details
Closed on
Jul 21, 2021
Sold by
Hensley Karen R
Bought by
Hensley Leroy E
Purchase Details
Closed on
Sep 24, 2001
Sold by
Henrikson Duncan
Bought by
Hensley Leroy E + Karen R
Purchase Details
Closed on
Feb 21, 1991
Sold by
Jackson Marion Parvin
Bought by
Henrikson Duncan
Purchase Details
Closed on
Jan 4, 1991
Sold by
Jackson Martin O
Bought by
Jackson Marion Parvin
Create a Home Valuation Report for This Property
The Home Valuation Report is an in-depth analysis detailing your home's value as well as a comparison with similar homes in the area
Home Values in the Area
Average Home Value in this Area
Purchase History
| Date | Buyer | Sale Price | Title Company |
|---|---|---|---|
| Hensley Leroy E | -- | None Listed On Document | |
| Hensley Leroy E | -- | None Listed On Document | |
| Hensley Leroy E | -- | None Available | |
| Hensley Leroy E + Karen R | $53,000 | -- | |
| Henrikson Duncan | $9,500 | -- | |
| Jackson Marion Parvin | -- | -- |
Source: Public Records
Tax History
| Year | Tax Paid | Tax Assessment Tax Assessment Total Assessment is a certain percentage of the fair market value that is determined by local assessors to be the total taxable value of land and additions on the property. | Land | Improvement |
|---|---|---|---|---|
| 2024 | $498 | $5,030 | -- | -- |
| 2023 | $504 | $8,720 | $1,010 | $7,710 |
| 2022 | $493 | $4,970 | $530 | $4,440 |
| 2021 | $509 | $5,110 | $540 | $4,570 |
| 2020 | $2,515 | $4,780 | $540 | $4,240 |
| 2019 | $361 | $3,578 | $375 | $3,203 |
| 2018 | $242 | $2,665 | $378 | $2,287 |
| 2017 | $244 | $2,665 | $378 | $2,287 |
| 2016 | $234 | $2,570 | $418 | $2,152 |
| 2015 | $233 | $2,570 | $418 | $2,152 |
| 2014 | $249 | $2,740 | $418 | $2,322 |
Source: Public Records
Map
Nearby Homes
Your Personal Tour Guide
Ask me questions while you tour the home.