1308 Ely St Allegan, MI 49010
Estimated Value: $234,000 - $278,000
3
Beds
1
Bath
1,300
Sq Ft
$197/Sq Ft
Est. Value
About This Home
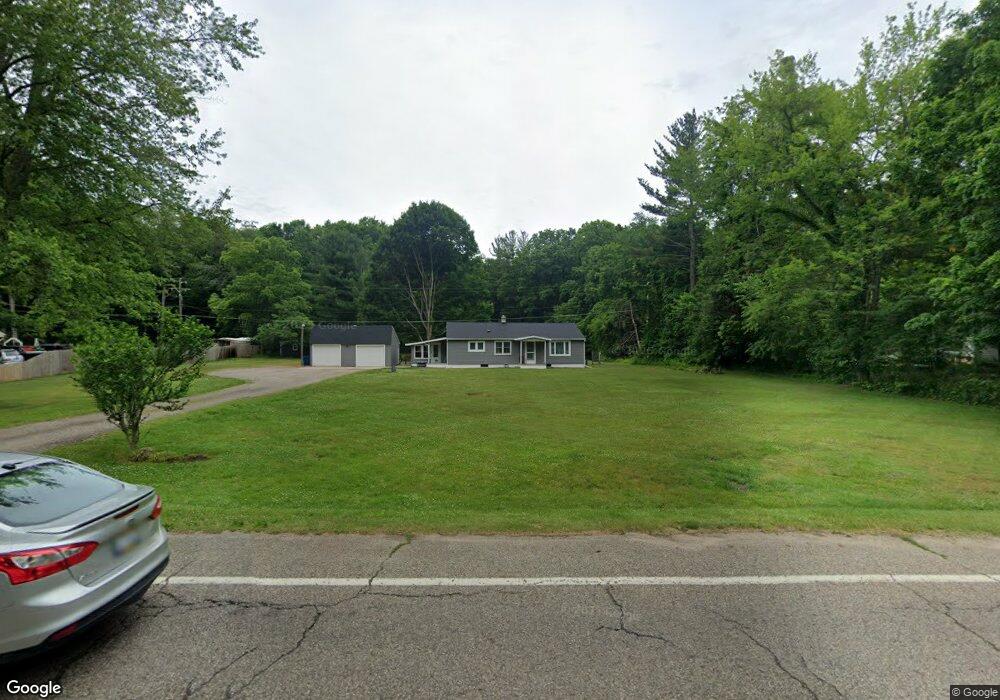
This home is located at 1308 Ely St, Allegan, MI 49010 and is currently estimated at $256,516, approximately $197 per square foot. 1308 Ely St is a home located in Allegan County with nearby schools including West Ward Elementary School, L.E. White Middle School, and Allegan High School.
Ownership History
Date
Name
Owned For
Owner Type
Purchase Details
Closed on
Mar 28, 2025
Sold by
Beckers Edith M
Bought by
Beckers Jack Charles and Beckers Sara
Current Estimated Value
Home Financials for this Owner
Home Financials are based on the most recent Mortgage that was taken out on this home.
Original Mortgage
$204,000
Outstanding Balance
$201,983
Interest Rate
6.85%
Mortgage Type
New Conventional
Estimated Equity
$54,533
Purchase Details
Closed on
Dec 16, 2003
Sold by
Wallace Charyl J and Loll Randolph J
Bought by
Beckers Edith M
Home Financials for this Owner
Home Financials are based on the most recent Mortgage that was taken out on this home.
Original Mortgage
$72,800
Interest Rate
6.03%
Mortgage Type
Purchase Money Mortgage
Purchase Details
Closed on
Jun 14, 2000
Sold by
Loll Robert
Bought by
Loll Robert
Create a Home Valuation Report for This Property
The Home Valuation Report is an in-depth analysis detailing your home's value as well as a comparison with similar homes in the area
Home Values in the Area
Average Home Value in this Area
Purchase History
| Date | Buyer | Sale Price | Title Company |
|---|---|---|---|
| Beckers Jack Charles | $255,000 | None Listed On Document | |
| Beckers Jack Charles | $255,000 | None Listed On Document | |
| Beckers Edith M | $91,000 | Chicago Title | |
| Loll Robert | -- | -- | |
| Loll Robert Trust | -- | -- |
Source: Public Records
Mortgage History
| Date | Status | Borrower | Loan Amount |
|---|---|---|---|
| Open | Beckers Jack Charles | $204,000 | |
| Closed | Beckers Jack Charles | $204,000 | |
| Previous Owner | Beckers Edith M | $72,800 |
Source: Public Records
Tax History Compared to Growth
Tax History
| Year | Tax Paid | Tax Assessment Tax Assessment Total Assessment is a certain percentage of the fair market value that is determined by local assessors to be the total taxable value of land and additions on the property. | Land | Improvement |
|---|---|---|---|---|
| 2025 | $1,799 | $90,200 | $27,400 | $62,800 |
| 2024 | $1,638 | $85,000 | $27,000 | $58,000 |
| 2023 | $1,638 | $72,200 | $21,400 | $50,800 |
| 2022 | $1,638 | $63,800 | $20,000 | $43,800 |
| 2021 | $1,518 | $59,600 | $18,900 | $40,700 |
| 2020 | $1,518 | $53,600 | $16,300 | $37,300 |
| 2019 | $0 | $50,300 | $14,600 | $35,700 |
| 2018 | $0 | $48,600 | $15,400 | $33,200 |
| 2017 | $0 | $46,400 | $15,300 | $31,100 |
| 2016 | $0 | $44,900 | $15,300 | $29,600 |
| 2015 | -- | $44,900 | $15,300 | $29,600 |
| 2014 | -- | $41,800 | $14,800 | $27,000 |
| 2013 | -- | $42,200 | $15,500 | $26,700 |
Source: Public Records
Map
Nearby Homes