NOT LISTED FOR SALE

1308 Jefferson St Quincy, IL 62301

Estimated Value: $121,000 - $156,000

3 Beds
1 Bath
-- Sq Ft
8,276 Sq Ft Lot

Last Sold August 12, 2020

Last sale price $88,500

Est. 52% increase in value since last sale

Current estimated payment $874/month

Highlights

  • Ranch Style House
  • Patio
  • Garage
  • Porch
  • Ceiling Fan

About This Home

As of August 2020

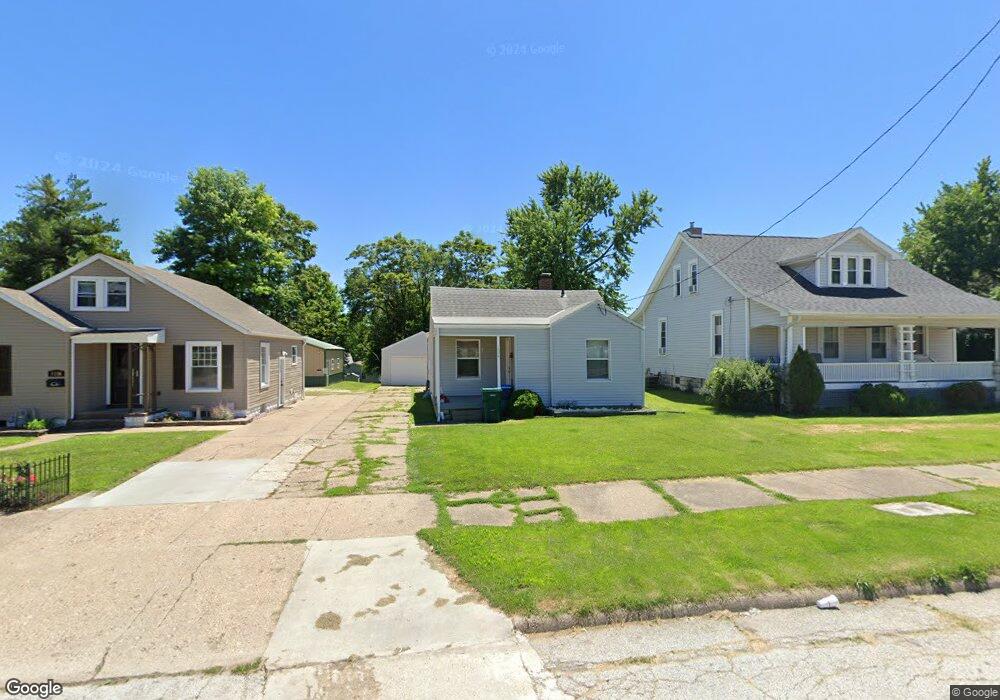
Well maintained inside and out. Beautiful hardwood floors throughout. Original trim. Spacious and very roomy with a great back yard (Fire pit also). The basement has been freshly painted allowing for additional usable living space. Windows replaced in 2019, Roof 2012, & Water heater in 2013. Garage is an oversized 1 car (could get 2 smaller vehicles) or 1 vehicle plus outdoor essentials.

Last Agent to Sell the Property

Jackie Weisenburger

Happel, Inc., REALTORS License #475141177 Listed on: 04/10/2020

Last Buyer's Agent

Michelle Soltwedel

Happel, Inc., REALTORS License #475182958

Home Details

Home Type

  • Single Family

Est. Annual Taxes

  • $1,390

Lot Details

  • 8,276

Parking

  • Garage

Home Design

  • Ranch Style House

Interior Spaces

  • 1 Full Bathroom
  • Ceiling Fan
  • Oven or Range

Laundry

  • Dryer
  • Washer

Outdoor Features

  • Patio
  • Porch

Schools

  • Denman Elementary School

Home Details

Home Type

Single Family

Est. Annual Taxes

$1,390

Lot Details

0

Listing Details

  • Class: Residential
  • Type: Single Family
  • Style: Ranch
  • Unit Style: 1-Level
  • Special Features: None
  • Property Sub Type: Detached

Interior Features

  • Appliances: Dryer, Refrigerator, Range/Oven, Washer
  • Interior Amenities: Ceiling Fan
  • Total Bathrooms: 1
  • Total Full Baths: 1
  • Number of Main Level Full Bathrooms: 1
  • Bedrooms: 3
  • Basement Foundation: Full, Partial, Unfinished
  • Total Basement Sq Ft: 759
  • Price Per Sq Ft: 94.25
  • Total Sq Ft: 939

Exterior Features

  • Exterior: Vinyl Siding
  • Exterior Amenities: Patio, Porch

Garage/Parking

  • Garage Parking: Detached
  • Garage Yn: Yes
  • Number Cars: 1

Utilities

  • Heating Cooling: Gas, Forced Air, Water Heater - Gas, Central Air
  • Water Sewer: Public Sewer, Public Water

Schools

  • Elementary School: Denman
  • High School: Quincy School District #172
  • Elementary School: Denman

Lot Info

  • Estimated Lot Size: 42x198
  • Estimated Number of Acres: 0.19
  • Zoning: Residential
  • Additional Assessor Parcel Numbers: NW SEC 12 2S9W LANDS BEG 470FT E SE COR 12TH JEFFERSON S 198FT E 42 N 198 W 42 PT NW SEC 12
  • Geo Subdivision: IL

Tax Info

  • Annual Taxes: 1390
  • Parcel Id Number Tax Id: 23-7-0386-000-00
  • Tax Year: 2018

MLS Schools

  • High School School District: Quincy School District #172

Ownership History

Date Name Owned For Owner Type

Purchase Details

Listed on
Apr 10, 2020
Closed on
Aug 12, 2020
Sold by
Klingler Mark C
Bought by
Kimberley Vicky M
Seller's Agent
Jackie Weisenburger
Happel, Inc., REALTORS
Buyer's Agent
Michelle Soltwedel
Happel, Inc., REALTORS
List Price
$94,500
Sold Price
$88,500
Premium/Discount to List
-$6,000
-6.35%
Current Estimated Value
$134,256

Home Financials for this Owner

Home Financials are based on the most recent Mortgage that was taken out on this home.
Estimated Appreciation
$45,756
Avg. Annual Appreciation
8.41%
Original Mortgage
$86,896
Outstanding Balance
$76,721
Interest Rate
2.75%
Mortgage Type
FHA
Estimated Equity
$57,535
Source: Public Records

Range of Values:

Collateral Analytics

Collateral Analytics Collateral Analytics AVMs (Automated Valuation Model) employ a number of statistical approaches combined with neighborhood-specific comparable selection guarantees the most up-to-date and precise valuations.

Not Available

Collateral Analytics does not have data for the current month. Please view the chart for historical values.

ICE

ICE Mortgage Technology ICE Mortgage Technology’s AVM (Automated Valuation Model) is a state-of-the-art online residential property valuation tool that provides a quick and accurate estimate of the value of almost any home in the U.S.

Not Available

ICE Mortgage Technology does not have data for the current month. Please view the chart for historical values.

First American

First American First American Data & Analytics’ next-generation AVM combines unrivaled data assets with a blended ensemble of valuation models to produce highly accurate, reliable valuations you can trust.

Not Available

First American does not have data for the current month. Please view the chart for historical values.

Quantarium

Quantarium Quantarium’s valuation service, repeatedly proven the industry’s most accurate and comprehensive, is supercharged with a self-learning and auto-tuning AI engine that continually becomes smarter and more accurate as it processes daily inputs from the industry’s leading RE data lake.

Not Available

Quantarium does not have data for the current month. Please view the chart for historical values.

Average Value
Not Available
List Price
Sold Price
Create a Home Valuation Report for This Property
The Home Valuation Report is an in-depth analysis detailing your home's value as well as a comparison with similar homes in the area

Home Values in the Area

Source: Public Records

Average Home Value in this Area


Source: Public Records

Purchase History

Date Buyer Sale Price Title Company
Kimberley Vicky M $88,500 Title Center
Source: Public Records

Mortgage History

Date Status Borrower Loan Amount
Open Kimberley Vicky M $86,896
Source: Public Records

Property History

Date Event Price List to Sale Price per Sq Ft
08/12/2020 08/12/20 Sold $88,500 -6.3% --
07/13/2020 07/13/20 Pending -- -- --
04/10/2020 04/10/20 For Sale $94,500 -- --
Source: RMLS Alliance

Tax History Compared to Growth

Source: Public Records

Tax History

Year Tax Paid Tax Assessment Tax Assessment Total Assessment is a certain percentage of the fair market value that is determined by local assessors to be the total taxable value of land and additions on the property. Land Improvement
2024 $1,947 $35,860 $3,500 $32,360
2023 $1,804 $33,270 $3,250 $30,020
2022 $1,679 $31,060 $3,030 $28,030
2021 $1,619 $29,500 $2,970 $26,530
2020 $1,427 $20,700 $2,910 $17,790
2019 $1,401 $20,480 $2,880 $17,600
2018 $1,389 $20,080 $2,820 $17,260
2017 $1,355 $19,880 $2,790 $17,090
2016 $1,330 $19,070 $2,680 $16,390
2015 $1,277,360 $19,070 $2,680 $16,390
2012 $1,278 $18,440 $2,590 $15,850
Source: Public Records

Agents Affiliated with this Home

  • Section Image
  • Section Image
See All Agents

Map

Source: RMLS Alliance

MLS Number: RMACA199243_1

RMLS Alliance

APN: 23-7-0386-000-00