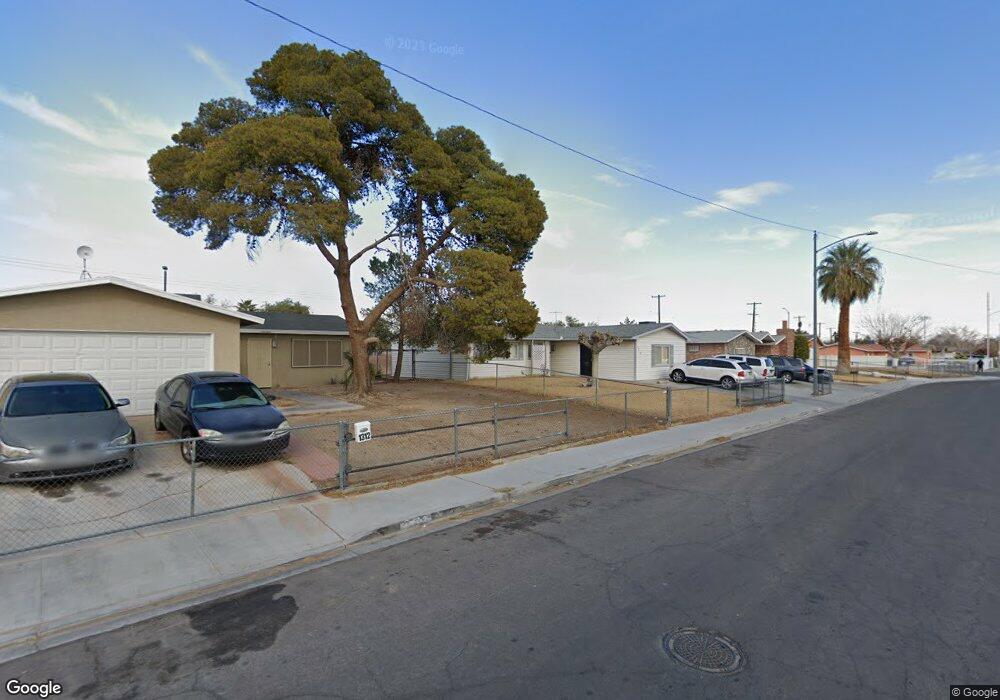
1308 Jimmy Ave Las Vegas, NV 89106
West Las Vegas NeighborhoodEstimated Value: $293,069 - $342,000
3
Beds
2
Baths
1,494
Sq Ft
$213/Sq Ft
Est. Value
About This Home
This home is located at 1308 Jimmy Ave, Las Vegas, NV 89106 and is currently estimated at $317,517, approximately $212 per square foot. 1308 Jimmy Ave is a home located in Clark County with nearby schools including Matt Kelly Elementary School, West Prepatory Academy At Charlles I West Hall Sec, and Canyon Springs High School And The Leadership And.
Ownership History
Date
Name
Owned For
Owner Type
Purchase Details
Closed on
Jun 24, 2021
Sold by
Vaughan Vikkie Alice and Meads Brenda Joyce
Bought by
Hines Dock W
Current Estimated Value
Home Financials for this Owner
Home Financials are based on the most recent Mortgage that was taken out on this home.
Original Mortgage
$220,000
Outstanding Balance
$199,492
Interest Rate
3%
Mortgage Type
VA
Estimated Equity
$118,025
Purchase Details
Closed on
Jun 6, 1997
Sold by
Davis J D and Davis Alberta R
Bought by
Davis J D and Davis Alberta R
Home Financials for this Owner
Home Financials are based on the most recent Mortgage that was taken out on this home.
Original Mortgage
$29,600
Interest Rate
8.08%
Purchase Details
Closed on
Mar 18, 1995
Sold by
Davis J D and Davis Alberta Rosetta
Bought by
Davis J D and Davis Alberta R
Create a Home Valuation Report for This Property
The Home Valuation Report is an in-depth analysis detailing your home's value as well as a comparison with similar homes in the area
Home Values in the Area
Average Home Value in this Area
Purchase History
| Date | Buyer | Sale Price | Title Company |
|---|---|---|---|
| Hines Dock W | $220,000 | Ticor Title Las Vegas Sum | |
| Davis J D | -- | Nevada Title Company | |
| Davis J D | -- | Nevada Title Company | |
| Davis J D | -- | -- |
Source: Public Records
Mortgage History
| Date | Status | Borrower | Loan Amount |
|---|---|---|---|
| Open | Hines Dock W | $220,000 | |
| Previous Owner | Davis J D | $29,600 |
Source: Public Records
Tax History Compared to Growth
Tax History
| Year | Tax Paid | Tax Assessment Tax Assessment Total Assessment is a certain percentage of the fair market value that is determined by local assessors to be the total taxable value of land and additions on the property. | Land | Improvement |
|---|---|---|---|---|
| 2025 | $507 | $44,713 | $26,250 | $18,463 |
| 2024 | $881 | $44,713 | $26,250 | $18,463 |
| 2023 | $401 | $40,789 | $24,150 | $16,639 |
| 2022 | $478 | $36,193 | $21,350 | $14,843 |
| 2021 | $464 | $32,732 | $18,900 | $13,832 |
| 2020 | $448 | $32,352 | $18,900 | $13,452 |
| 2019 | $435 | $24,527 | $11,550 | $12,977 |
| 2018 | $422 | $22,639 | $10,500 | $12,139 |
| 2017 | $716 | $21,826 | $9,800 | $12,026 |
| 2016 | $401 | $15,835 | $4,200 | $11,635 |
| 2015 | $399 | $15,460 | $3,500 | $11,960 |
| 2014 | $387 | $11,912 | $3,150 | $8,762 |
Source: Public Records
Map
Nearby Homes
- 1212 Eleanor Ave
- 1249 Hassell Ave
- 1030 W Lake Mead Blvd
- 1648 J St
- 1641 K St
- 1636 J St
- 1201 Leonard Ave
- 1101 Leonard Ave
- 2100 Fred Brown Dr
- 1316 Lawry Ave
- 1631 Dwayne Stedman Ave
- 1328 Balzar Ave
- 2222 N Martin l King Blvd
- 1212 Balzar Ave
- 1904 Hart Ave
- 832 Hart Ave
- 1908 Hart Ave
- 2109 Jesse Scott St
- 1972 H St
- 616 Bowman Ave
- 1304 Jimmy Ave
- 1312 Jimmy Ave
- 1300 Jimmy Ave
- 1305 Jimmy Ave
- 1404 Jimmy Ave
- 1301 Jimmy Ave
- 1909 Abbott St
- 1904 Abbott St
- 1408 Jimmy Ave
- 1212 Jimmy Ave
- 1905 Lexington St
- 1905 Abbott St
- 1936 Lexington St
- 1213 Jimmy Ave
- 1412 Jimmy Ave
- 1208 Jimmy Ave
- 1208 Jimmy Ave Unit house
- 1208 Jimmy Ave
- 1944 Lexington St
- 1209 Jimmy Ave