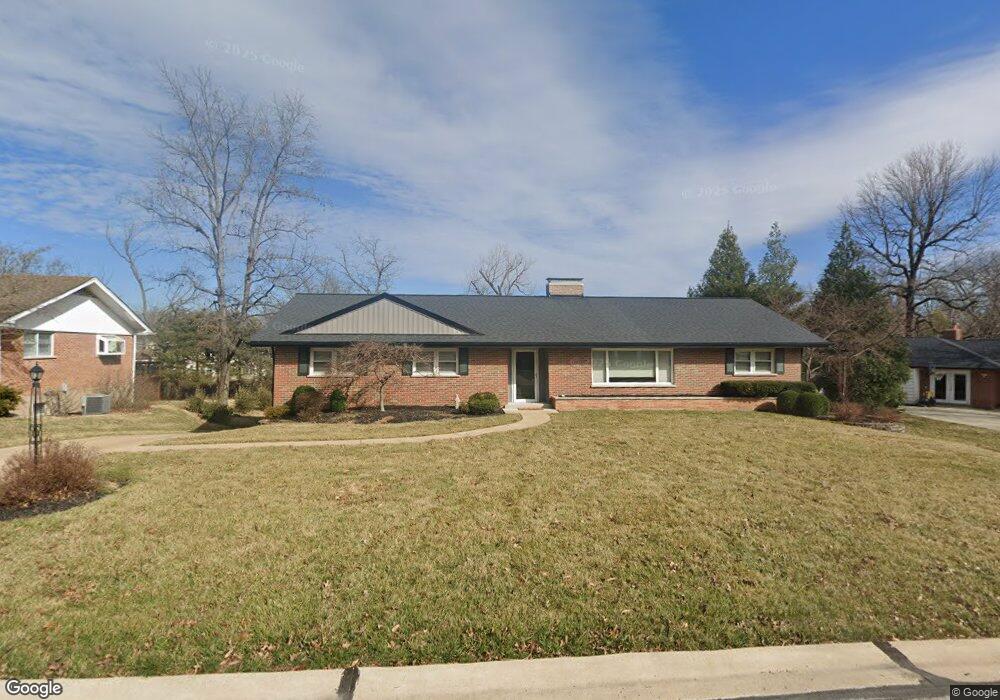
1308 Kendon Dr Saint Louis, MO 63131
Estimated Value: $516,000 - $776,000
3
Beds
4
Baths
2,000
Sq Ft
$316/Sq Ft
Est. Value
About This Home
This home is located at 1308 Kendon Dr, Saint Louis, MO 63131 and is currently estimated at $631,395, approximately $315 per square foot. 1308 Kendon Dr is a home located in St. Louis County with nearby schools including Westchester Elementary School, North Kirkwood Middle School, and Kirkwood Senior High School.
Ownership History
Date
Name
Owned For
Owner Type
Purchase Details
Closed on
Dec 3, 2012
Sold by
Quigley Kevin J and Quigley Jacqueline K
Bought by
Quigley Kevin J and Quigley Jacqueline K
Current Estimated Value
Purchase Details
Closed on
Feb 24, 2012
Sold by
Quigley Kevin J and Quigley Jackie K
Bought by
Quigley Kevin J and Quigley Jacqueline K
Home Financials for this Owner
Home Financials are based on the most recent Mortgage that was taken out on this home.
Original Mortgage
$182,600
Outstanding Balance
$22,193
Interest Rate
3.93%
Mortgage Type
New Conventional
Estimated Equity
$609,202
Purchase Details
Closed on
Mar 1, 1999
Sold by
Barry Gaillard F and Barry Thelma M
Bought by
Quigley Kevin J and Quigley Jackie K
Home Financials for this Owner
Home Financials are based on the most recent Mortgage that was taken out on this home.
Original Mortgage
$172,000
Interest Rate
6.73%
Purchase Details
Closed on
Dec 17, 1997
Sold by
Barry Gaillard F and Barry Thelma M
Bought by
Barry Gaillard F and Barry Thelma M
Create a Home Valuation Report for This Property
The Home Valuation Report is an in-depth analysis detailing your home's value as well as a comparison with similar homes in the area
Home Values in the Area
Average Home Value in this Area
Purchase History
| Date | Buyer | Sale Price | Title Company |
|---|---|---|---|
| Quigley Kevin J | -- | None Available | |
| Quigley Kevin J | -- | Touchstone Title | |
| Quigley Kevin J | $215,000 | -- | |
| Barry Gaillard F | -- | -- |
Source: Public Records
Mortgage History
| Date | Status | Borrower | Loan Amount |
|---|---|---|---|
| Open | Quigley Kevin J | $182,600 | |
| Closed | Quigley Kevin J | $172,000 |
Source: Public Records
Tax History Compared to Growth
Tax History
| Year | Tax Paid | Tax Assessment Tax Assessment Total Assessment is a certain percentage of the fair market value that is determined by local assessors to be the total taxable value of land and additions on the property. | Land | Improvement |
|---|---|---|---|---|
| 2025 | $5,623 | $119,930 | $70,320 | $49,610 |
| 2024 | $5,623 | $97,150 | $52,500 | $44,650 |
| 2023 | $5,535 | $97,150 | $52,500 | $44,650 |
| 2022 | $5,140 | $84,060 | $52,500 | $31,560 |
| 2021 | $5,085 | $84,060 | $52,500 | $31,560 |
| 2020 | $5,105 | $81,150 | $48,450 | $32,700 |
| 2019 | $5,112 | $81,150 | $48,450 | $32,700 |
| 2018 | $4,871 | $69,370 | $27,230 | $42,140 |
| 2017 | $4,884 | $69,370 | $27,230 | $42,140 |
| 2016 | $4,444 | $63,900 | $23,430 | $40,470 |
| 2015 | $4,450 | $63,900 | $23,430 | $40,470 |
| 2014 | $4,241 | $59,510 | $10,600 | $48,910 |
Source: Public Records
Map
Nearby Homes
- 1126 Bopp Rd
- 1345 Woodgate Dr
- 8 Briarbrook Trail
- 811 Cherry St
- 1090 Kinstern Dr
- 723 Oak Valley Dr
- 1728 Folkstone Dr
- 1029 Kinstern Dr
- 1741 Pine Hill Dr
- 11909 Lillian Ave
- 11913 Lillian Ave
- 12006 Montour Dr
- 11358 Manchester Rd
- 1001 Dovergate Dr
- 918 N Ballas Rd
- 12224 TBB Roger Ln
- 12439 Springdale Ln Unit TBB
- 1120 Simmons Ave
- 936 Poinsetta Ln
- 1710 Lynkirk Ln
- 1300 Kendon Dr
- 1314 Kendon Dr
- 1318 Kendon Dr
- 1311 Kendon Dr
- 1447 Fawnvalley Dr
- 1319 Kendon Dr
- 1439 Fawnvalley Dr
- 1455 Fawnvalley Dr
- 1301 Kendon Dr
- 11800 Bayberry Ln
- 1327 Kendon Dr
- 1463 Fawnvalley Dr
- 11812 Bayberry Ln
- 1400 Kendon Dr
- 1431 Fawnvalley Dr
- 11827 Bayberry Ln
- 1471 Fawnvalley Dr
- 11912 Hargrove Dr
- 11822 Bayberry Ln
- 1408 Kendon Dr