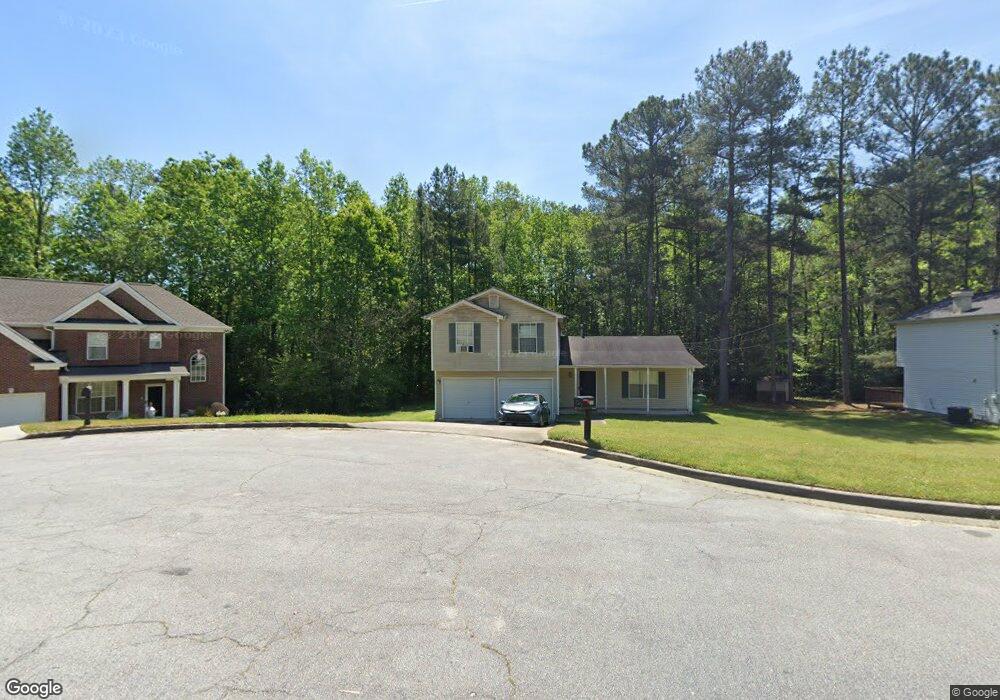
1308 Sandybrook Ct Lithonia, GA 30058
Estimated Value: $250,000 - $281,000
3
Beds
3
Baths
1,893
Sq Ft
$138/Sq Ft
Est. Value
About This Home
This home is located at 1308 Sandybrook Ct, Lithonia, GA 30058 and is currently estimated at $260,502, approximately $137 per square foot. 1308 Sandybrook Ct is a home located in DeKalb County with nearby schools including Princeton Elementary School, Lithonia Middle School, and Lithonia High School.
Ownership History
Date
Name
Owned For
Owner Type
Purchase Details
Closed on
Mar 18, 2011
Sold by
Federal Natl Mtg Assn Fnma
Bought by
Frank Ann E
Current Estimated Value
Home Financials for this Owner
Home Financials are based on the most recent Mortgage that was taken out on this home.
Original Mortgage
$53,507
Outstanding Balance
$37,551
Interest Rate
5.25%
Mortgage Type
FHA
Estimated Equity
$222,951
Purchase Details
Closed on
Mar 2, 2010
Sold by
Bac Home Loans Servicing Lp
Bought by
Federal Natl Mtg Assn Fnma
Purchase Details
Closed on
Aug 31, 1998
Sold by
Barnes Ent Inc
Bought by
Brown Lisa I
Home Financials for this Owner
Home Financials are based on the most recent Mortgage that was taken out on this home.
Original Mortgage
$91,700
Interest Rate
6.96%
Mortgage Type
FHA
Create a Home Valuation Report for This Property
The Home Valuation Report is an in-depth analysis detailing your home's value as well as a comparison with similar homes in the area
Home Values in the Area
Average Home Value in this Area
Purchase History
| Date | Buyer | Sale Price | Title Company |
|---|---|---|---|
| Frank Ann E | -- | -- | |
| Federal Natl Mtg Assn Fnma | -- | -- | |
| Bac Home Loans Servicing Lp | $119,170 | -- | |
| Brown Lisa I | $92,900 | -- |
Source: Public Records
Mortgage History
| Date | Status | Borrower | Loan Amount |
|---|---|---|---|
| Open | Frank Ann E | $53,507 | |
| Previous Owner | Brown Lisa I | $91,700 |
Source: Public Records
Tax History Compared to Growth
Tax History
| Year | Tax Paid | Tax Assessment Tax Assessment Total Assessment is a certain percentage of the fair market value that is determined by local assessors to be the total taxable value of land and additions on the property. | Land | Improvement |
|---|---|---|---|---|
| 2025 | $2,627 | $94,280 | $16,000 | $78,280 |
| 2024 | $2,724 | $96,320 | $16,000 | $80,320 |
| 2023 | $2,724 | $102,360 | $16,000 | $86,360 |
| 2022 | $2,578 | $93,280 | $16,000 | $77,280 |
| 2021 | $1,878 | $62,920 | $4,000 | $58,920 |
| 2020 | $1,689 | $54,560 | $4,000 | $50,560 |
| 2019 | $1,650 | $53,440 | $4,000 | $49,440 |
| 2018 | $1,180 | $43,080 | $4,000 | $39,080 |
| 2017 | $1,389 | $40,840 | $4,000 | $36,840 |
| 2016 | $1,217 | $36,800 | $4,000 | $32,800 |
| 2014 | $632 | $19,640 | $4,000 | $15,640 |
Source: Public Records
Map
Nearby Homes
- 1309 Sandybrook Ct
- 6856 Hill Creek Cove
- 6843 Hill Creek Cove
- 1286 Regal Heights Dr
- 6492 Swift Creek Rd
- 1213 Oak Knoll Ct
- 6987 Dalehollow Dr
- 6536 Deshon Ct
- 1528 Rogers Crossing Dr
- 6507 Swift Creek Dr
- 6504 Swift Creek Dr
- 6941 Rogers Point
- 6956 Rogers Point
- 6531 Edenfield Dr
- 6449 Rebecca Lou Ln Unit 3
- 1124 Shady Creek Dr
- 1512 Rogers Preserve Rd
- 1362 Rogers Trace
- 1276 Huntington Place Cir
- 1370 Rogers Trace
- 1316 Sandybrook Ct
- 1304 Sandybrook Ct
- 1301 Sandybrook Ct Unit 4
- 1322 Sandybrook Ct Unit 1322
- 1322 Sandybrook Ct
- 6731 Hill Creek Cove
- 1305 Sandybrook Ct
- 6739 Hill Creek Cove
- 6723 Hill Creek Cove
- 1317 Sandybrook Ct
- 6747 Hill Creek Cove
- 1325 Sandybrook Ct
- 6755 Hill Creek Cove
- 6715 Hill Creek Cove
- 6732 Hill Creek Cove
- 6614 Rebecca Lou Ln
- 6614 Rebecca Lou Ln Unit IV
- 6740 Hill Creek Cove
- 6604 Rebecca Lou Ln Unit 4
- 6763 Hill Creek Cove