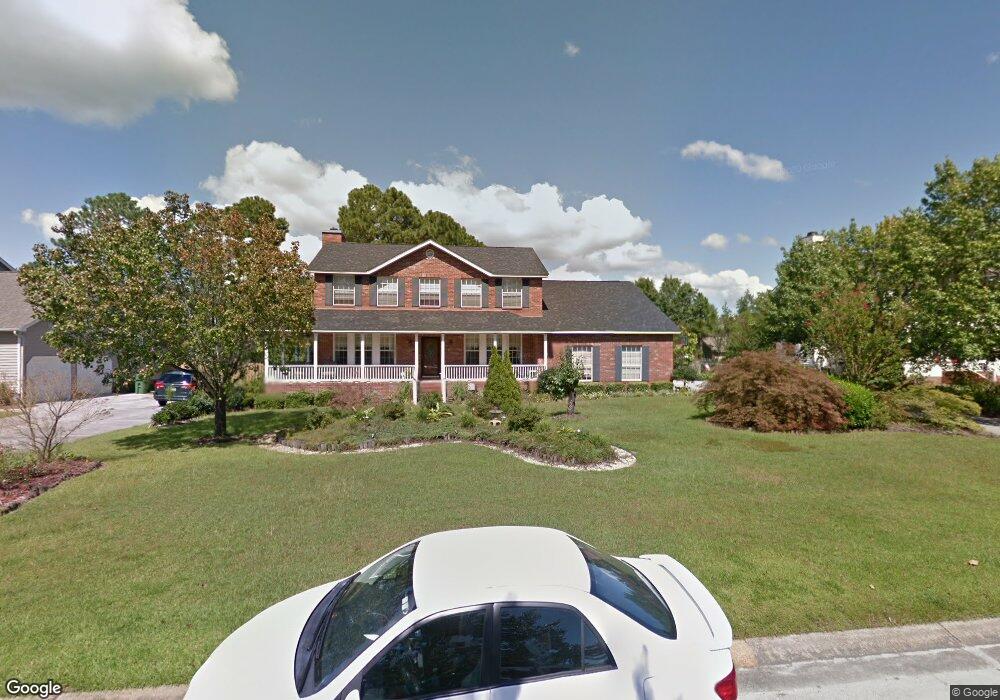
1308 Williamsburg Ct Wilmington, NC 28411
Estimated Value: $550,000 - $600,000
5
Beds
3
Baths
2,968
Sq Ft
$194/Sq Ft
Est. Value
About This Home
This home is located at 1308 Williamsburg Ct, Wilmington, NC 28411 and is currently estimated at $574,335, approximately $193 per square foot. 1308 Williamsburg Ct is a home located in New Hanover County with nearby schools including Murrayville Elementary School, Emma B. Trask Middle School, and Emsley A. Laney High School.
Ownership History
Date
Name
Owned For
Owner Type
Purchase Details
Closed on
Aug 18, 2020
Sold by
Le Phuc and Ly Lan Thi
Bought by
Le Andy and Ly Lan Bach
Current Estimated Value
Purchase Details
Closed on
Jun 7, 2000
Sold by
Howerly Family Trust
Bought by
Le Phuc Lan Thi Ly
Purchase Details
Closed on
Sep 23, 1999
Sold by
Spencer Linda L Exec
Bought by
Howerly Family Trust Etal
Purchase Details
Closed on
Jan 15, 1999
Sold by
Howery Mamie Agee
Bought by
Spencer Linda L
Purchase Details
Closed on
Jan 6, 1994
Sold by
Spencer Linda L
Bought by
Spencer Linda L
Purchase Details
Closed on
Sep 24, 1993
Sold by
Terhane Group Inc
Bought by
Spencer Linda L
Purchase Details
Closed on
Aug 12, 1993
Sold by
Coastal Carolina Dev Inc
Bought by
Terhane Group Inc
Purchase Details
Closed on
Nov 27, 1989
Sold by
Coastal Carolina Devel Inc
Bought by
Terhane Group Inc
Purchase Details
Closed on
Jun 1, 1987
Bought by
Coastal Carolina Devel Inc
Create a Home Valuation Report for This Property
The Home Valuation Report is an in-depth analysis detailing your home's value as well as a comparison with similar homes in the area
Home Values in the Area
Average Home Value in this Area
Purchase History
| Date | Buyer | Sale Price | Title Company |
|---|---|---|---|
| Le Andy | -- | None Available | |
| Le Phuc Lan Thi Ly | $220,000 | -- | |
| Howerly Family Trust Etal | -- | -- | |
| Spencer Linda L | -- | -- | |
| Spencer Linda L | -- | -- | |
| Spencer Linda L | $180,000 | -- | |
| Terhane Group Inc | $76,000 | -- | |
| Terhane Group Inc | $71,500 | -- | |
| Coastal Carolina Devel Inc | -- | -- |
Source: Public Records
Tax History Compared to Growth
Tax History
| Year | Tax Paid | Tax Assessment Tax Assessment Total Assessment is a certain percentage of the fair market value that is determined by local assessors to be the total taxable value of land and additions on the property. | Land | Improvement |
|---|---|---|---|---|
| 2025 | $1,004 | $548,300 | $123,500 | $424,800 |
| 2024 | $1,004 | $370,300 | $74,800 | $295,500 |
| 2023 | $1,001 | $370,300 | $74,800 | $295,500 |
| 2022 | $1,516 | $370,300 | $74,800 | $295,500 |
| 2021 | $1,530 | $370,300 | $74,800 | $295,500 |
| 2020 | $1,945 | $307,500 | $47,300 | $260,200 |
| 2019 | $1,945 | $307,500 | $47,300 | $260,200 |
| 2018 | $0 | $307,500 | $47,300 | $260,200 |
| 2017 | $1,991 | $307,500 | $47,300 | $260,200 |
| 2016 | $1,900 | $274,200 | $47,300 | $226,900 |
| 2015 | $1,766 | $274,200 | $47,300 | $226,900 |
| 2014 | $1,736 | $274,200 | $47,300 | $226,900 |
Source: Public Records
Map
Nearby Homes
- 1132 Potomac Ct
- 7319 Thurgood Rd
- 7542 Quail Woods Rd
- 6707 Creek Ridge Rd
- 6918 Haberdeen Dr
- 802 Calico Crossing
- 6924 Aida Ct
- 2522 White Rd
- 6723 Newbury Way
- 7213 Thurgood Rd
- 7012 Brittany Lakes Dr
- 1303 Big Horn Ct
- 2431 White Rd
- 6803 Murrayville Rd
- 6404 Shire Ln
- 2805 Valor Dr Unit 207
- 800 Caspian Ct
- 5824 Hyatt Ln
- 2417 White Rd
- 2824 White Rd
- 1312 Williamsburg Ct
- 1215 Potomac Ct
- 1211 Potomac Ct
- 1316 Williamsburg Ct
- 1300 Williamsburg Ct
- 1309 Williamsburg Ct
- 1207 Potomac Ct
- 1305 Williamsburg Ct
- 1219 Potomac Ct
- 1313 Williamsburg Ct
- 1301 Williamsburg Ct
- 1320 Williamsburg Ct
- 1223 Potomac Ct
- 1201 Potomac Ct
- 1317 Williamsburg Ct
- 1232 Williamsburg Ct
- 1212 Potomac Ct
- 1229 Williamsburg Ct
- 1216 Potomac Ct
- 1227 Potomac Ct