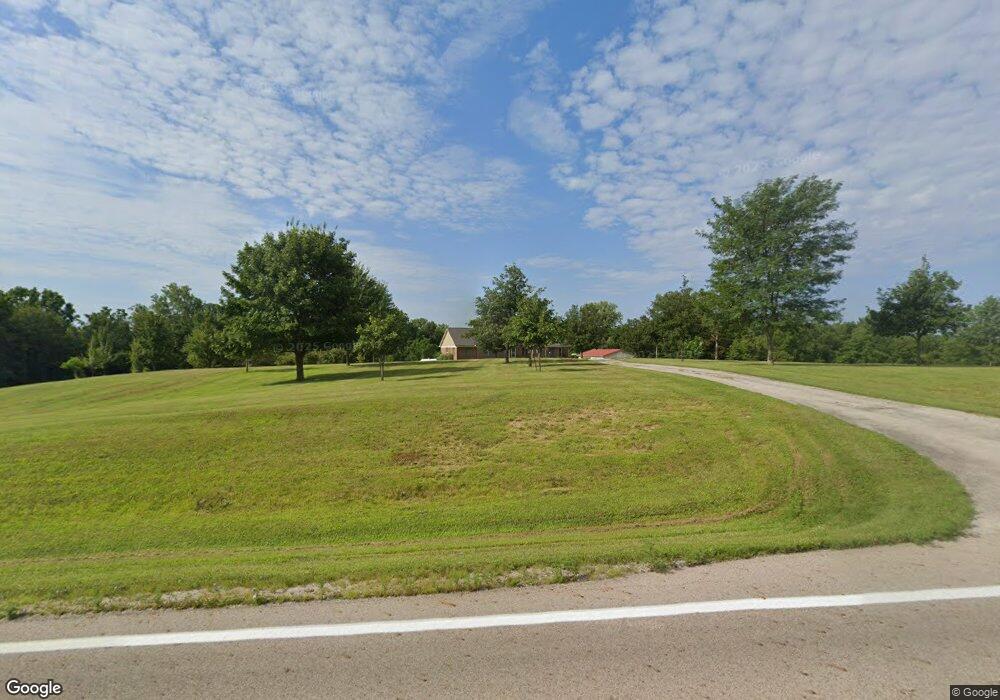
13081 W State Route 29 Conover, OH 45317
Estimated Value: $296,000 - $752,000
4
Beds
6
Baths
3,079
Sq Ft
$181/Sq Ft
Est. Value
About This Home
This home is located at 13081 W State Route 29, Conover, OH 45317 and is currently estimated at $558,567, approximately $181 per square foot. 13081 W State Route 29 is a home located in Champaign County with nearby schools including Graham Elementary School, Graham Middle School, and Graham High School.
Ownership History
Date
Name
Owned For
Owner Type
Purchase Details
Closed on
Jun 21, 2010
Sold by
Trame Laurence J and Laurence J Trame Trust
Bought by
Trame Laurence J and Trame Dawn R
Current Estimated Value
Home Financials for this Owner
Home Financials are based on the most recent Mortgage that was taken out on this home.
Original Mortgage
$272,000
Interest Rate
4.77%
Mortgage Type
New Conventional
Purchase Details
Closed on
Feb 27, 2008
Sold by
Trame Laurence J and Trame Dawn R
Bought by
Trame Laurence J and The Laurence J Trame Trust
Home Financials for this Owner
Home Financials are based on the most recent Mortgage that was taken out on this home.
Original Mortgage
$274,000
Interest Rate
5.75%
Mortgage Type
New Conventional
Purchase Details
Closed on
Jun 27, 2006
Sold by
Trame Laurence J and Trame Dawn R
Bought by
Trame Laurence J and The Laurence J Trame Trust
Create a Home Valuation Report for This Property
The Home Valuation Report is an in-depth analysis detailing your home's value as well as a comparison with similar homes in the area
Home Values in the Area
Average Home Value in this Area
Purchase History
| Date | Buyer | Sale Price | Title Company |
|---|---|---|---|
| Trame Laurence J | -- | Attorney | |
| Trame Laurence J | -- | Attorney | |
| Trame Laurence J | -- | Attorney | |
| Trame Laurence J | -- | None Available |
Source: Public Records
Mortgage History
| Date | Status | Borrower | Loan Amount |
|---|---|---|---|
| Closed | Trame Laurence J | $272,000 | |
| Closed | Trame Laurence J | $274,000 |
Source: Public Records
Tax History Compared to Growth
Tax History
| Year | Tax Paid | Tax Assessment Tax Assessment Total Assessment is a certain percentage of the fair market value that is determined by local assessors to be the total taxable value of land and additions on the property. | Land | Improvement |
|---|---|---|---|---|
| 2024 | $6,406 | $169,620 | $43,780 | $125,840 |
| 2023 | $6,406 | $169,620 | $43,780 | $125,840 |
| 2022 | $6,668 | $169,620 | $43,780 | $125,840 |
| 2021 | $5,844 | $139,890 | $35,020 | $104,870 |
| 2020 | $5,660 | $139,890 | $35,020 | $104,870 |
| 2019 | $5,773 | $139,890 | $35,020 | $104,870 |
| 2018 | $4,556 | $109,670 | $23,990 | $85,680 |
| 2017 | $3,948 | $109,670 | $23,990 | $85,680 |
| 2016 | $3,918 | $109,670 | $23,990 | $85,680 |
| 2015 | $3,876 | $105,810 | $23,990 | $81,820 |
| 2014 | $3,915 | $105,810 | $23,990 | $81,820 |
| 2013 | $3,981 | $105,810 | $23,990 | $81,820 |
Source: Public Records
Map
Nearby Homes
- 13147 Shanley Rd
- 148 Dorsey Hageman Rd
- 8475 State Route 29
- 207 South St
- 8676 Sidney St
- 4401 Knoop-Johnston Rd
- 101 Maple Dr
- 7210 N Bollinger Rd
- 111 Rupolo Dr
- 115 S High St
- 203 W Main St
- 1262 N Heck Hill Rd
- 0 Dingman-Slagle Rd Unit 1856661
- 0 Dingman-Slagle Rd Unit 1039895
- 0 Dingman-Slagle Rd Unit 225034870
- 7650 Calland Rd
- 2199 Bulle Rd
- 126 Bowersock Ave
- 218 W Troy St
- 211 Dugan St
- 13110 Ohio 29
- 13000 W State Route 29
- 13210 W State Route 29
- 13371 W State Route 29
- 13449 W State Route 29
- 12729 W State Route 29
- 6491 N Elm Tree Rd
- 12475 W State Route 29
- 12463 W State Route 29
- 13759 State Route 29 W
- 6024 N Elm Tree Rd
- 12472 W State Route 29
- 6256 N Elm Tree Rd
- 12229 W State Route 29
- 6588 N State Route 235
- 5750 N Elm Tree Rd
- 13906 State Route 29 W
- 13900 Sargents Rd
- 6000 N Elm Tree Rd
- 7453 Elm Tree Rd N