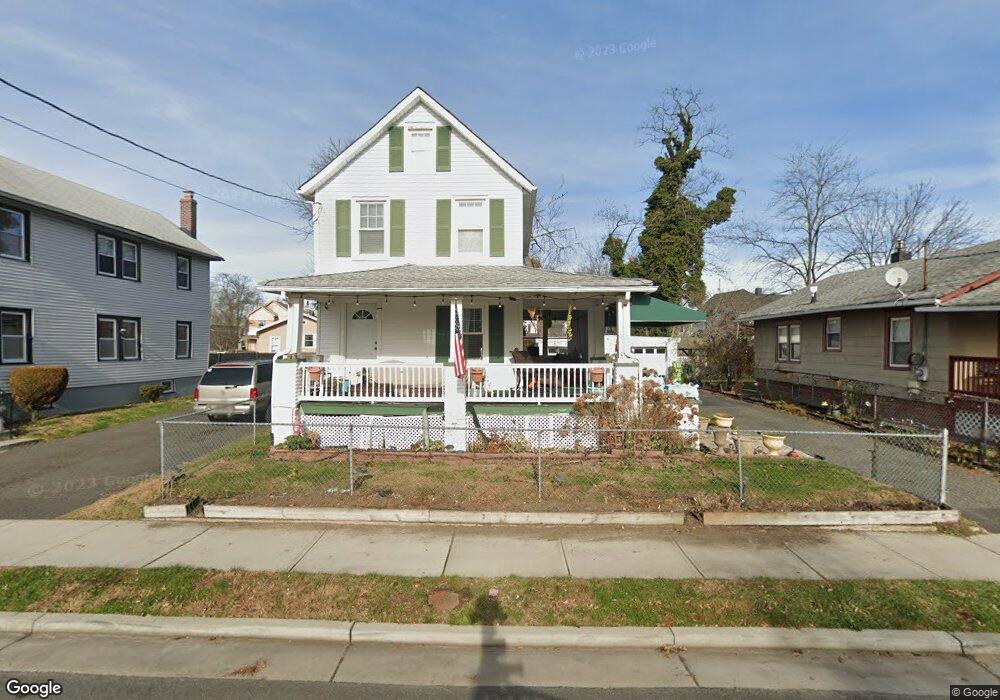
1309 10th Ave Neptune, NJ 07753
Estimated Value: $422,000 - $456,776
2
Beds
1
Bath
1,120
Sq Ft
$388/Sq Ft
Est. Value
About This Home
This home is located at 1309 10th Ave, Neptune, NJ 07753 and is currently estimated at $434,444, approximately $387 per square foot. 1309 10th Ave is a home located in Monmouth County with nearby schools including Neptune High School.
Ownership History
Date
Name
Owned For
Owner Type
Purchase Details
Closed on
Oct 15, 2004
Sold by
Harris Reuben
Bought by
Anderson Anthony and Anderson Lina
Current Estimated Value
Home Financials for this Owner
Home Financials are based on the most recent Mortgage that was taken out on this home.
Original Mortgage
$144,000
Outstanding Balance
$71,029
Interest Rate
5.71%
Estimated Equity
$363,415
Purchase Details
Closed on
Sep 28, 2004
Sold by
Harris Reuben
Bought by
Anderson Anthony and Anderson Lina
Home Financials for this Owner
Home Financials are based on the most recent Mortgage that was taken out on this home.
Original Mortgage
$144,000
Outstanding Balance
$71,029
Interest Rate
5.71%
Estimated Equity
$363,415
Purchase Details
Closed on
Dec 11, 1998
Sold by
Wakefield & Wakefield Land Co
Bought by
Harris Reuben and Harris Shirley
Home Financials for this Owner
Home Financials are based on the most recent Mortgage that was taken out on this home.
Original Mortgage
$85,992
Interest Rate
6.74%
Mortgage Type
FHA
Purchase Details
Closed on
Apr 10, 1997
Sold by
Pnc Bk
Bought by
Land Wakefield and Land Wakefield
Create a Home Valuation Report for This Property
The Home Valuation Report is an in-depth analysis detailing your home's value as well as a comparison with similar homes in the area
Home Values in the Area
Average Home Value in this Area
Purchase History
| Date | Buyer | Sale Price | Title Company |
|---|---|---|---|
| Anderson Anthony | $180,000 | -- | |
| Anderson Anthony | $180,000 | -- | |
| Harris Reuben | $88,000 | -- | |
| Land Wakefield | $32,000 | -- |
Source: Public Records
Mortgage History
| Date | Status | Borrower | Loan Amount |
|---|---|---|---|
| Open | Anderson Anthony | $144,000 | |
| Closed | Anderson Anthony | $144,000 | |
| Previous Owner | Harris Reuben | $85,992 |
Source: Public Records
Tax History Compared to Growth
Tax History
| Year | Tax Paid | Tax Assessment Tax Assessment Total Assessment is a certain percentage of the fair market value that is determined by local assessors to be the total taxable value of land and additions on the property. | Land | Improvement |
|---|---|---|---|---|
| 2025 | $6,964 | $427,200 | $252,900 | $174,300 |
| 2024 | $6,081 | $397,700 | $239,900 | $157,800 |
| 2023 | $6,081 | $336,700 | $182,600 | $154,100 |
| 2022 | $4,835 | $299,000 | $148,000 | $151,000 |
| 2021 | $4,429 | $228,800 | $112,700 | $116,100 |
| 2020 | $4,513 | $213,100 | $103,100 | $110,000 |
| 2019 | $4,429 | $206,500 | $103,100 | $103,400 |
| 2018 | $4,344 | $200,200 | $97,500 | $102,700 |
| 2017 | $4,475 | $198,100 | $103,000 | $95,100 |
| 2016 | $4,679 | $206,600 | $113,000 | $93,600 |
| 2015 | $4,216 | $189,300 | $98,000 | $91,300 |
| 2014 | $4,091 | $151,000 | $53,000 | $98,000 |
Source: Public Records
Map
Nearby Homes
- 503 Ridge Ave
- 1317 7th Ave
- 1221 11th Ave
- 1409 7th Ave
- 152 Division St
- 45 Ridge Ave
- 1329 6th Ave
- 1501 Cherry Ln
- 152 Myrtle Ave
- 601/603 Route 35
- 3 5th Ave Unit Residence 209
- 3 5th Ave Unit Residence 406
- 3 5th Ave Unit Residence 203
- 3 5th Ave Unit Residence 108
- 3 5th Ave Unit Residence 301
- 1509 Embury Ave
- 1502 Heck Ave
- 55 N Route 35 Unit 12A
- 1608 Heck Ave
- 1601 Heck Ave