P
Seller's Agent in 2025
Patsy Martin
Coldwell Banker Walden & Kirkland
(229) 343-8197
4 in this area
64 Total Sales
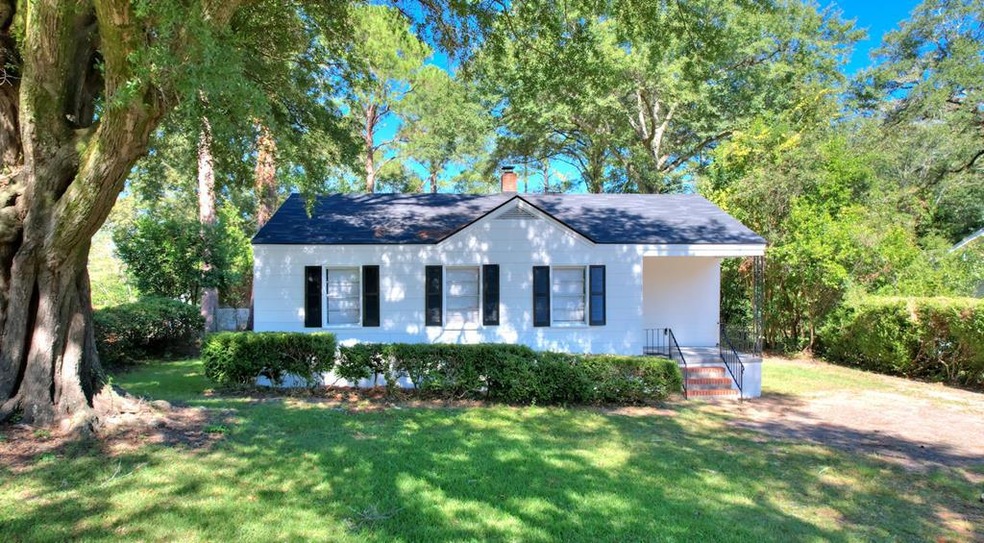
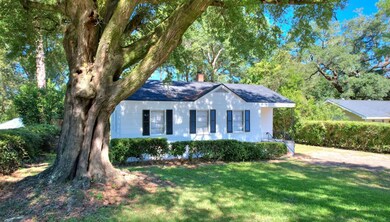
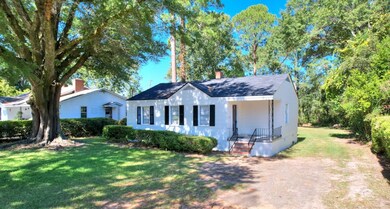
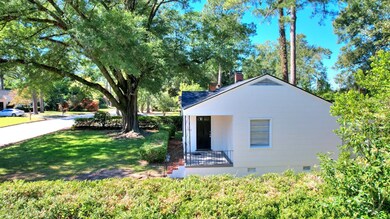
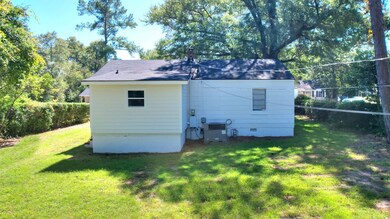
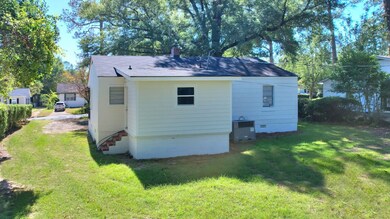
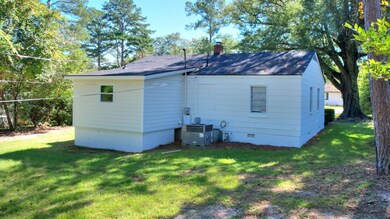
Charming 3 BR, 1 BA cottage on the avenues. Much updating has been done by the current owner. Hardwoods t/0 most of the home. Ideal for first time homebuyer, investor or someone looking to downsize.
Last Agent to Sell the Property
Coldwell Banker Walden & Kirkland Brokerage Phone: 2294368811 License #40270 Listed on: 09/17/2024

Last Buyer's Agent
Coldwell Banker Walden & Kirkland Brokerage Phone: 2294368811 License #40270 Listed on: 09/17/2024
| Date | Type | Sale Price | Title Company |
|---|---|---|---|
| Limited Warranty Deed | $103,000 | -- | |
| Warranty Deed | $17,000 | -- | |
| Deed | $50,000 | -- | |
| Deed | -- | -- |
| Date | Status | Loan Amount | Loan Type |
|---|---|---|---|
| Open | $82,400 | New Conventional | |
| Previous Owner | $47,500 | Commercial | |
| Closed | $0 | New Conventional |
| Date | Event | Price | List to Sale | Price per Sq Ft |
|---|---|---|---|---|
| 01/27/2025 01/27/25 | Off Market | $115,900 | -- | -- |
| 01/20/2025 01/20/25 | Sold | $103,000 | -11.1% | $112 / Sq Ft |
| 12/28/2024 12/28/24 | Pending | -- | -- | -- |
| 11/24/2024 11/24/24 | Price Changed | $115,900 | -7.3% | $127 / Sq Ft |
| 11/22/2024 11/22/24 | Price Changed | $125,000 | +7.9% | $136 / Sq Ft |
| 10/22/2024 10/22/24 | Price Changed | $115,900 | -7.3% | $127 / Sq Ft |
| 09/17/2024 09/17/24 | For Sale | $125,000 | -- | $136 / Sq Ft |
| Year | Tax Paid | Tax Assessment Tax Assessment Total Assessment is a certain percentage of the fair market value that is determined by local assessors to be the total taxable value of land and additions on the property. | Land | Improvement |
|---|---|---|---|---|
| 2024 | $966 | $20,240 | $6,080 | $14,160 |
| 2023 | $943 | $20,240 | $6,080 | $14,160 |
| 2022 | $318 | $20,240 | $6,080 | $14,160 |
| 2021 | $877 | $20,240 | $6,080 | $14,160 |
| 2020 | $880 | $20,240 | $6,080 | $14,160 |
| 2019 | $883 | $20,240 | $6,080 | $14,160 |
| 2018 | $887 | $20,240 | $6,080 | $14,160 |
| 2017 | $826 | $20,240 | $6,080 | $14,160 |
| 2016 | $826 | $20,240 | $6,080 | $14,160 |
| 2015 | $829 | $20,240 | $6,080 | $14,160 |
| 2014 | $881 | $21,800 | $7,640 | $14,160 |
P
Seller's Agent in 2025
Patsy Martin
Coldwell Banker Walden & Kirkland
(229) 343-8197
4 in this area
64 Total Sales
Source: Albany Board of REALTORS®
MLS Number: 163602
APN: 0000G-00003-005