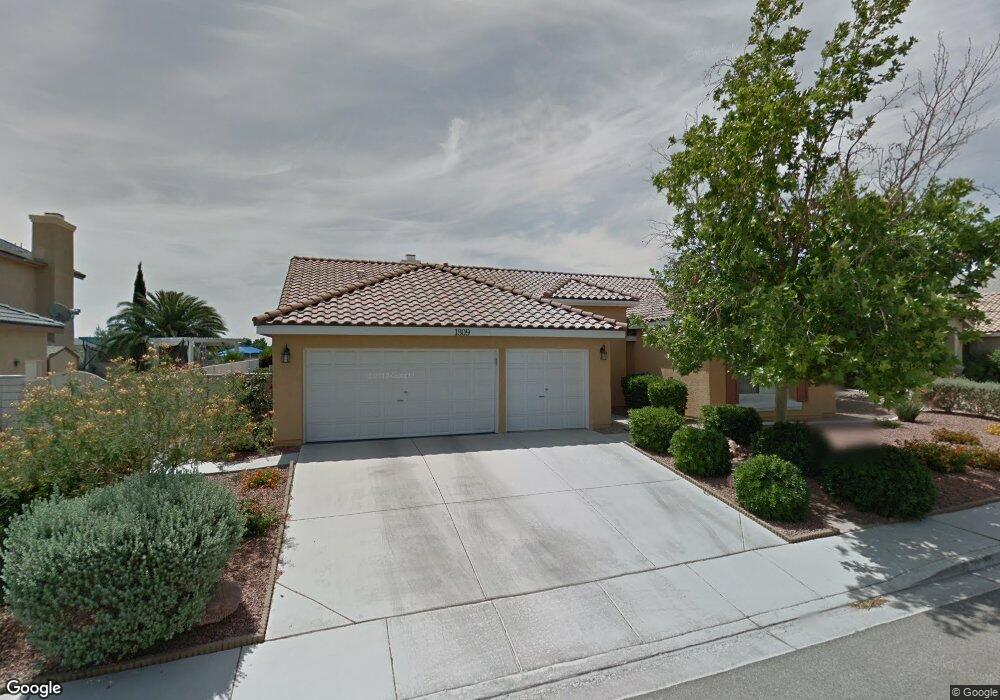
1309 Crescent Moon Dr North Las Vegas, NV 89031
Craig Ranch NeighborhoodEstimated Value: $495,625 - $567,000
3
Beds
3
Baths
2,294
Sq Ft
$237/Sq Ft
Est. Value
About This Home
This home is located at 1309 Crescent Moon Dr, North Las Vegas, NV 89031 and is currently estimated at $543,406, approximately $236 per square foot. 1309 Crescent Moon Dr is a home located in Clark County with nearby schools including Lee Antonello Elementary School, Brian & Teri Cram Middle School, and Legacy High School.
Ownership History
Date
Name
Owned For
Owner Type
Purchase Details
Closed on
May 2, 2006
Sold by
Harris James A
Bought by
The Harris Family Trust
Current Estimated Value
Purchase Details
Closed on
Jul 6, 1998
Sold by
Harris James A
Bought by
Harris James A
Home Financials for this Owner
Home Financials are based on the most recent Mortgage that was taken out on this home.
Original Mortgage
$116,200
Outstanding Balance
$23,842
Interest Rate
7.03%
Estimated Equity
$519,564
Purchase Details
Closed on
Oct 20, 1994
Sold by
Harris Kathleen S
Bought by
Harris James A
Home Financials for this Owner
Home Financials are based on the most recent Mortgage that was taken out on this home.
Original Mortgage
$118,100
Interest Rate
5.25%
Purchase Details
Closed on
Jun 17, 1994
Sold by
Pardee Construction Company Of Nevada
Bought by
Harris James A
Create a Home Valuation Report for This Property
The Home Valuation Report is an in-depth analysis detailing your home's value as well as a comparison with similar homes in the area
Home Values in the Area
Average Home Value in this Area
Purchase History
| Date | Buyer | Sale Price | Title Company |
|---|---|---|---|
| The Harris Family Trust | -- | None Available | |
| Harris James A | -- | Ati Title | |
| Harris James A | -- | National Title Company | |
| Harris James A | $165,500 | National Title Company |
Source: Public Records
Mortgage History
| Date | Status | Borrower | Loan Amount |
|---|---|---|---|
| Open | Harris James A | $116,200 | |
| Closed | Harris James A | $118,100 |
Source: Public Records
Tax History Compared to Growth
Tax History
| Year | Tax Paid | Tax Assessment Tax Assessment Total Assessment is a certain percentage of the fair market value that is determined by local assessors to be the total taxable value of land and additions on the property. | Land | Improvement |
|---|---|---|---|---|
| 2025 | $2,124 | $120,159 | $43,050 | $77,109 |
| 2024 | $1,967 | $120,159 | $43,050 | $77,109 |
| 2023 | $1,967 | $111,562 | $40,600 | $70,962 |
| 2022 | $1,913 | $99,502 | $34,300 | $65,202 |
| 2021 | $1,858 | $94,383 | $32,200 | $62,183 |
| 2020 | $1,752 | $93,016 | $31,150 | $61,866 |
| 2019 | $1,701 | $88,666 | $27,650 | $61,016 |
| 2018 | $1,652 | $80,283 | $21,350 | $58,933 |
| 2017 | $2,387 | $73,809 | $19,250 | $54,559 |
| 2016 | $1,564 | $65,284 | $16,450 | $48,834 |
| 2015 | $1,561 | $51,676 | $12,250 | $39,426 |
| 2014 | $1,515 | $47,114 | $10,500 | $36,614 |
Source: Public Records
Map
Nearby Homes
- 1323 Borderwood Ln
- 5912 Hollowridge Rd
- 1515 Fort Dix Cir
- 1415 Black Hills Way
- 6136 Benchmark Way
- 1003 Dover Glen Dr
- 5871 Prairie Ridge Cir
- 901 Sage Hollow Cir
- 1009 Nawkee Dr
- 825 Cornerstone Place
- 6219 Disruptor St Unit 3
- 6126 Leaning Rock Ct
- 1611 Spotted Pony Dr
- 6056 Fort Wayne Ct
- 6236 Badgerglen Place
- 920 Grey Hollow Ave
- 5808 Lone Song Rd
- 6241 Golden Rain St
- 721 W Azure Ave
- 5829 Forest Creek Rd
- 1317 Crescent Moon Dr
- 1301 Crescent Moon Dr
- 1227 Crescent Moon Dr
- 1312 Crescent Moon Dr
- 1325 Crescent Moon Dr
- 1304 Crescent Moon Dr
- 1320 Crescent Moon Dr
- 1234 Crescent Moon Dr
- 1328 Crescent Moon Dr
- 1219 Crescent Moon Dr
- 1226 Crescent Moon Dr
- 1321 Moorpoint Dr
- 1313 Moorpoint Dr
- 1329 Moorpoint Dr
- 1305 Moorpoint Dr
- 6001 Starpoint Rd
- 6009 Starpoint Rd
- 1211 Crescent Moon Dr
- 1337 Moorpoint Dr
- 1218 Crescent Moon Dr