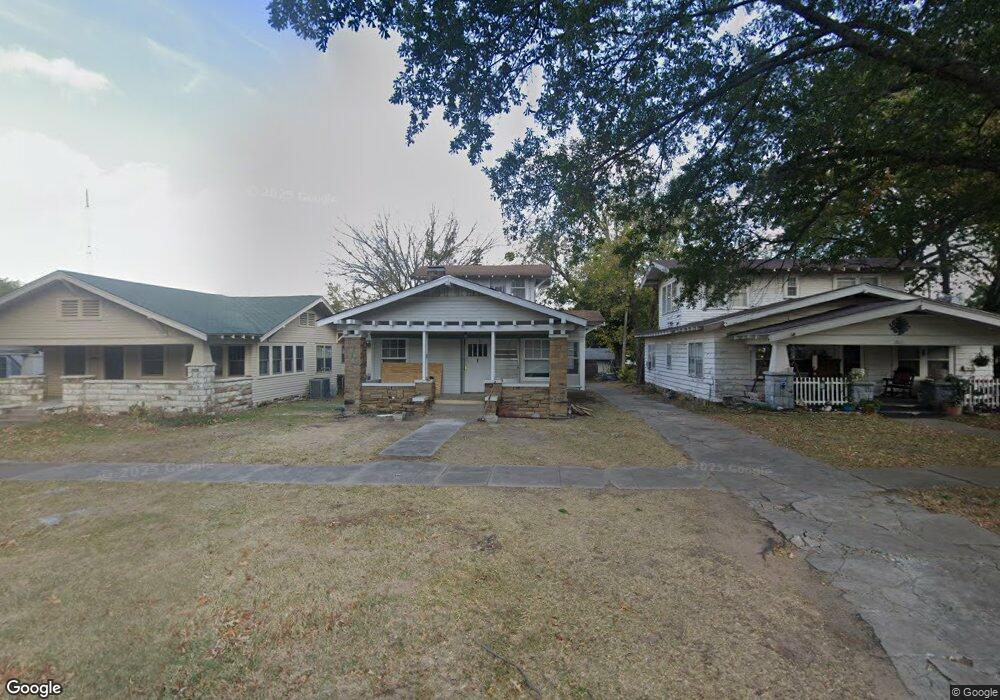
1309 E 9th St Okmulgee, OK 74447
Estimated Value: $104,272 - $111,000
3
Beds
2
Baths
1,498
Sq Ft
$72/Sq Ft
Est. Value
About This Home
This home is located at 1309 E 9th St, Okmulgee, OK 74447 and is currently estimated at $107,568, approximately $71 per square foot. 1309 E 9th St is a home located in Okmulgee County with nearby schools including Okmulgee Primary School, Dunbar Elementary School, and Okmulgee Middle School.
Ownership History
Date
Name
Owned For
Owner Type
Purchase Details
Closed on
Jul 23, 2024
Sold by
Ziegler James
Bought by
Okmulgee Chiropractic Inc
Current Estimated Value
Purchase Details
Closed on
Apr 20, 2023
Sold by
Rice Eddie
Bought by
First National Bank & Trust Company Of Okmulg
Purchase Details
Closed on
Apr 13, 2012
Sold by
Payton Roy F and Payton Norma L
Bought by
Godfrey Cecilla A
Home Financials for this Owner
Home Financials are based on the most recent Mortgage that was taken out on this home.
Original Mortgage
$42,300
Interest Rate
3.97%
Mortgage Type
New Conventional
Purchase Details
Closed on
Dec 29, 1994
Sold by
Pickard Retha
Bought by
Payton Roy
Create a Home Valuation Report for This Property
The Home Valuation Report is an in-depth analysis detailing your home's value as well as a comparison with similar homes in the area
Home Values in the Area
Average Home Value in this Area
Purchase History
| Date | Buyer | Sale Price | Title Company |
|---|---|---|---|
| Okmulgee Chiropractic Inc | -- | None Listed On Document | |
| First National Bank & Trust Company Of Okmulg | -- | None Listed On Document | |
| Godfrey Cecilla A | $47,000 | None Available | |
| Payton Roy | -- | -- |
Source: Public Records
Mortgage History
| Date | Status | Borrower | Loan Amount |
|---|---|---|---|
| Previous Owner | Godfrey Cecilla A | $42,300 |
Source: Public Records
Tax History
| Year | Tax Paid | Tax Assessment Tax Assessment Total Assessment is a certain percentage of the fair market value that is determined by local assessors to be the total taxable value of land and additions on the property. | Land | Improvement |
|---|---|---|---|---|
| 2025 | $406 | $4,435 | $360 | $4,075 |
| 2024 | $382 | $4,224 | $360 | $3,864 |
| 2023 | $361 | $4,241 | $360 | $3,881 |
| 2022 | $359 | $4,241 | $360 | $3,881 |
| 2021 | $369 | $4,241 | $360 | $3,881 |
| 2020 | $352 | $3,976 | $360 | $3,616 |
| 2019 | $334 | $3,787 | $360 | $3,427 |
| 2018 | $323 | $3,606 | $360 | $3,246 |
| 2017 | $304 | $3,435 | $360 | $3,075 |
| 2016 | $290 | $3,271 | $360 | $2,911 |
| 2015 | $489 | $5,674 | $360 | $5,314 |
| 2014 | $513 | $5,922 | $360 | $5,562 |
Source: Public Records
Map
Nearby Homes
Your Personal Tour Guide
Ask me questions while you tour the home.