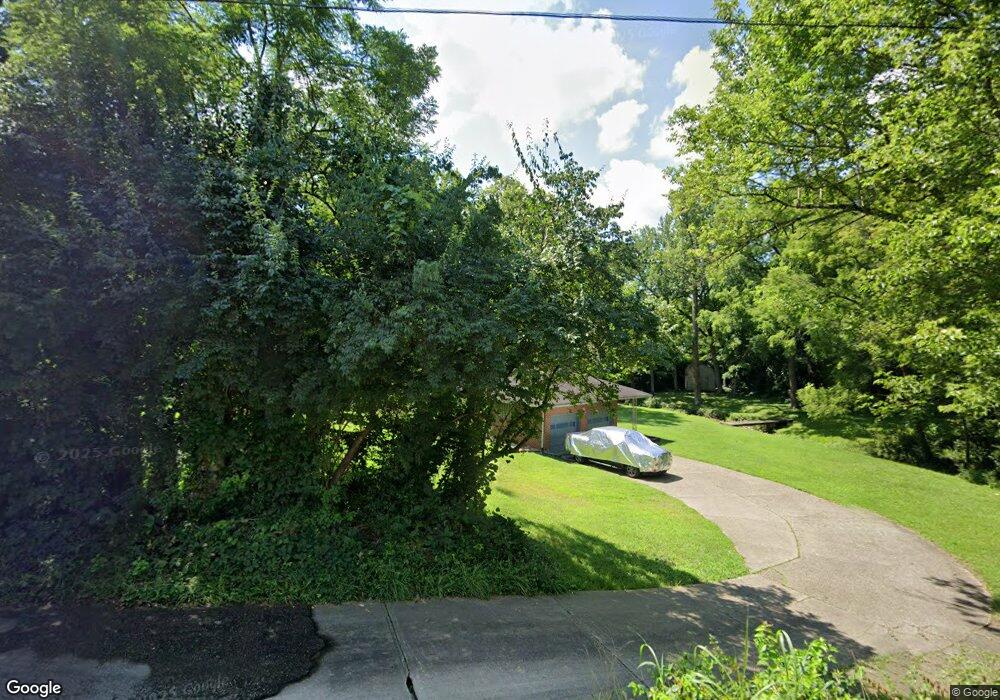
1309 E Lytle 5 Points Rd Dayton, OH 45458
Estimated Value: $247,000 - $317,162
2
Beds
1
Bath
1,102
Sq Ft
$256/Sq Ft
Est. Value
About This Home
This home is located at 1309 E Lytle 5 Points Rd, Dayton, OH 45458 and is currently estimated at $282,291, approximately $256 per square foot. 1309 E Lytle 5 Points Rd is a home located in Warren County with nearby schools including Clearcreek Elementary School, Springboro Intermediate School, and Springboro Junior High School.
Ownership History
Date
Name
Owned For
Owner Type
Purchase Details
Closed on
Dec 18, 2006
Sold by
Kammer Jack G and Kammer Bonnie S
Bought by
Lytle Clearcreek Partners Ltd
Current Estimated Value
Purchase Details
Closed on
Oct 14, 1999
Sold by
Cagle Ronald
Bought by
Kammer Jack G and Kammer Bonnie S
Home Financials for this Owner
Home Financials are based on the most recent Mortgage that was taken out on this home.
Original Mortgage
$87,200
Interest Rate
7.9%
Mortgage Type
New Conventional
Purchase Details
Closed on
Jul 9, 1991
Sold by
Beasley Alan Wm and Beasley Bonit
Bought by
Cagle and Cagle Ronald D
Purchase Details
Closed on
Oct 16, 1984
Sold by
Janning Shirley and Janning Haslup
Bought by
Beasley and Alan Wm
Purchase Details
Closed on
Nov 23, 1983
Sold by
Haslup Edward M and Haslup Edward M
Bought by
Janning and Janning Shirley
Purchase Details
Closed on
Dec 5, 1980
Sold by
Haslup Haslup and Haslup Edna L
Create a Home Valuation Report for This Property
The Home Valuation Report is an in-depth analysis detailing your home's value as well as a comparison with similar homes in the area
Home Values in the Area
Average Home Value in this Area
Purchase History
| Date | Buyer | Sale Price | Title Company |
|---|---|---|---|
| Lytle Clearcreek Partners Ltd | $190,000 | Landamerica | |
| Kammer Jack G | $109,000 | -- | |
| Cagle | $83,500 | -- | |
| Beasley | $55,500 | -- | |
| Janning | -- | -- | |
| -- | -- | -- |
Source: Public Records
Mortgage History
| Date | Status | Borrower | Loan Amount |
|---|---|---|---|
| Previous Owner | Kammer Jack G | $87,200 |
Source: Public Records
Tax History
| Year | Tax Paid | Tax Assessment Tax Assessment Total Assessment is a certain percentage of the fair market value that is determined by local assessors to be the total taxable value of land and additions on the property. | Land | Improvement |
|---|---|---|---|---|
| 2025 | $2,892 | $69,010 | $29,000 | $40,010 |
| 2024 | $2,892 | $69,010 | $29,000 | $40,010 |
| 2023 | $2,342 | $52,454 | $16,943 | $35,511 |
| 2022 | $2,342 | $52,455 | $16,944 | $35,511 |
| 2021 | $2,203 | $52,455 | $16,944 | $35,511 |
| 2020 | $2,073 | $42,648 | $13,776 | $28,872 |
| 2019 | $1,925 | $42,648 | $13,776 | $28,872 |
| 2018 | $1,915 | $42,648 | $13,776 | $28,872 |
| 2017 | $1,785 | $35,588 | $11,802 | $23,786 |
| 2016 | $1,857 | $35,588 | $11,802 | $23,786 |
| 2015 | $1,842 | $35,588 | $11,802 | $23,786 |
| 2014 | $1,842 | $33,440 | $11,210 | $22,230 |
| 2013 | $1,842 | $40,760 | $13,230 | $27,530 |
Source: Public Records
Map
Nearby Homes
- 9101 Remy Ct
- 1232 Normandy Rue
- 1226 Normandy Rue
- 1211 Normandy Rue
- 1214 Normandy Rue
- 1198 Normandy Rue
- 9155 Remy Ct
- 9333 Rochelle Ln
- 1645 Elmbrook Trail
- 1669 Elm Brook Trail
- 1669 Elmbrook Trail
- 9197 Remy Ct
- 9369 Avingnon Way
- 9372 Aspen Brook Ct
- 8711 Nicole Ln
- 9410 Rochelle Ln
- 9417 Rochelle Ln
- 811 Wind Bluff Point
- 9629 Linden Brook Dr
- 1315 Bourdeaux Way
- 1310 E Lytle 5 Points Rd
- 1263 E Lytle 5 Points Rd
- 1372 E Lytle 5 Points Rd
- 1372 E Lytle 5 Points Rd
- 1242 E Lytle 5 Points Rd
- 1377 E Lytle 5 Points Rd
- 1372 W Lytle-Five Points Rd
- 1372 W Lytle 5 Points Rd
- 1226 E Lytle 5 Points Rd
- 1189 W Lytle 5 Points Rd
- 1422 E Lytle 5 Points Rd
- 1150 Lytle Five E
- 1149 E Lytle-Five Points Rd
- 1149 E Lytle 5 Points Rd
- 1149 E Lytle Five Points Rd
- 1150 E Lytle 5 Points Rd
- 1190 E Lytle 5 Points Rd
- 9040 State Route 48
- 1129 E Lytle 5 Points Rd
- 0 E Lytle 5 Points Rd
Your Personal Tour Guide
Ask me questions while you tour the home.