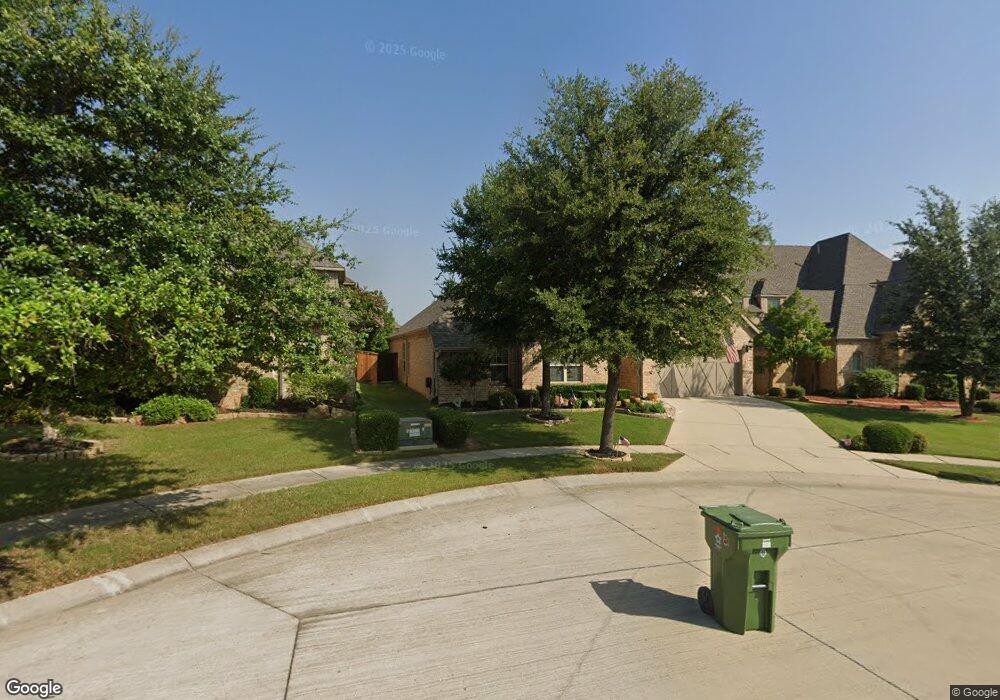
1309 Foxglove Cir Lantana, TX 76226
Estimated Value: $598,000 - $673,000
4
Beds
4
Baths
2,910
Sq Ft
$215/Sq Ft
Est. Value
About This Home
This home is located at 1309 Foxglove Cir, Lantana, TX 76226 and is currently estimated at $625,321, approximately $214 per square foot. 1309 Foxglove Cir is a home located in Denton County with nearby schools including Blanton Elementary School, Harpool Middle School, and Guyer High School.
Ownership History
Date
Name
Owned For
Owner Type
Purchase Details
Closed on
May 10, 2011
Sold by
Mooney Jerrold W and Mooney Noreen H
Bought by
Mooney Jerrold Warren and Mooney Noreen Helen
Current Estimated Value
Purchase Details
Closed on
Dec 27, 2010
Sold by
Highland Homes Ltd
Bought by
Mooney Jerrold W and Mooney Noreen H
Home Financials for this Owner
Home Financials are based on the most recent Mortgage that was taken out on this home.
Original Mortgage
$80,000
Outstanding Balance
$53,567
Interest Rate
4.41%
Mortgage Type
New Conventional
Estimated Equity
$571,754
Purchase Details
Closed on
Dec 15, 2009
Sold by
Bandera/Lantana Lp
Bought by
Highland Homes Ltd
Home Financials for this Owner
Home Financials are based on the most recent Mortgage that was taken out on this home.
Original Mortgage
$250,500
Interest Rate
5.01%
Mortgage Type
Purchase Money Mortgage
Create a Home Valuation Report for This Property
The Home Valuation Report is an in-depth analysis detailing your home's value as well as a comparison with similar homes in the area
Home Values in the Area
Average Home Value in this Area
Purchase History
| Date | Buyer | Sale Price | Title Company |
|---|---|---|---|
| Mooney Jerrold Warren | -- | None Available | |
| Mooney Jerrold W | -- | Ort | |
| Highland Homes Ltd | -- | Reunion Title |
Source: Public Records
Mortgage History
| Date | Status | Borrower | Loan Amount |
|---|---|---|---|
| Open | Mooney Jerrold W | $80,000 | |
| Previous Owner | Highland Homes Ltd | $250,500 | |
| Closed | Mooney Jerrold Warren | $0 |
Source: Public Records
Tax History Compared to Growth
Tax History
| Year | Tax Paid | Tax Assessment Tax Assessment Total Assessment is a certain percentage of the fair market value that is determined by local assessors to be the total taxable value of land and additions on the property. | Land | Improvement |
|---|---|---|---|---|
| 2025 | $6,715 | $590,187 | $140,700 | $461,478 |
| 2024 | $11,069 | $536,534 | $0 | $0 |
| 2023 | $5,781 | $487,758 | $140,700 | $473,300 |
| 2022 | $10,216 | $443,416 | $105,525 | $377,475 |
| 2021 | $10,048 | $403,105 | $84,420 | $318,685 |
| 2020 | $9,949 | $383,363 | $84,420 | $298,943 |
| 2019 | $10,395 | $382,807 | $84,420 | $298,387 |
| 2018 | $10,373 | $373,425 | $84,420 | $289,005 |
| 2017 | $9,759 | $350,000 | $84,420 | $265,580 |
| 2016 | $9,687 | $347,391 | $72,109 | $279,404 |
| 2015 | $8,104 | $315,810 | $72,109 | $243,701 |
| 2014 | $8,104 | $323,936 | $72,109 | $251,827 |
| 2013 | -- | $299,999 | $72,109 | $227,890 |
Source: Public Records
Map
Nearby Homes
- 1305 Foxglove Cir
- 1244 Grant Ave
- 1232 Grant Ave
- 1236 Claire St
- 8628 Silverleaf Cir
- 1701 Trinidad Way
- 9200 White Birch Trail
- 9300 Pecan Woods Trail
- 901 Fannin Dr
- 8416 Cholla Blvd
- 8213 Cholla Blvd
- 1651 Meadows Ave
- 9000 Cedar Ridge
- 9413 Blackpine Ct
- 1404 Pitaya Dr
- 1321 Verbena Ln
- 9040 Charles St
- 1591 Bonham Pkwy
- 8161 Watson Rd
- 8920 Charles St
- 1313 Foxglove Cir
- 1312 Fire Wheel Way
- 1308 Fire Wheel Way
- 1316 Fire Wheel Way
- 1301 Foxglove Cir
- 1304 Fire Wheel Way
- 1300 Foxglove Cir
- 1401 Goldenrod Cir
- 1312 Foxglove Cir
- 1308 Foxglove Cir
- 1304 Foxglove Cir
- 1309 Fire Wheel Way
- 8725 Bayberry Ave
- 8721 Bayberry Ave
- 8729 Bayberry Ave
- 1405 Goldenrod Cir
- 8717 Bayberry Ave
- 1400 Fire Wheel Way
- 1313 Fire Wheel Way
- 1317 Fire Wheel Way