Estimated Value: $233,545 - $333,000
3
Beds
2
Baths
1,878
Sq Ft
$146/Sq Ft
Est. Value
About This Home
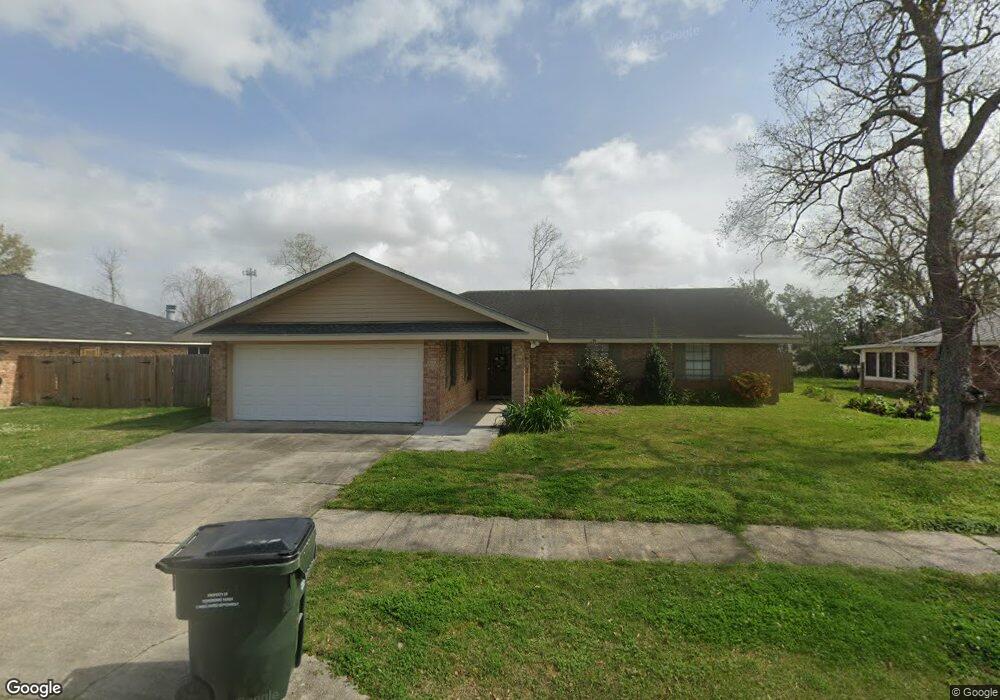
This home is located at 1309 Levee Dr, Houma, LA 70360 and is currently estimated at $274,636, approximately $146 per square foot. 1309 Levee Dr is a home located in Terrebonne Parish with nearby schools including Mulberry Elementary School, Houma Junior High School, and Terrebonne High School.
Ownership History
Date
Name
Owned For
Owner Type
Purchase Details
Closed on
Aug 6, 2021
Sold by
Sigurdsson Thor and Kilvitis Holly
Bought by
Bergeron Brennan T and Kraemer-Bergeron Kimberly
Current Estimated Value
Home Financials for this Owner
Home Financials are based on the most recent Mortgage that was taken out on this home.
Original Mortgage
$242,424
Outstanding Balance
$220,767
Interest Rate
3%
Mortgage Type
Fannie Mae Freddie Mac
Estimated Equity
$53,869
Purchase Details
Closed on
Nov 15, 2018
Sold by
Kcrm Properties Llc
Bought by
Sigurdsson Thor and Kilvitis Holly
Home Financials for this Owner
Home Financials are based on the most recent Mortgage that was taken out on this home.
Original Mortgage
$208,335
Interest Rate
4.8%
Mortgage Type
Purchase Money Mortgage
Purchase Details
Closed on
Jun 26, 2018
Sold by
Bank Of New York Mellon
Bought by
Kcrm Properties Llc
Purchase Details
Closed on
May 14, 2018
Sold by
Odom Sam A and Odom Rosemary M
Bought by
Bank New York Mellon
Create a Home Valuation Report for This Property
The Home Valuation Report is an in-depth analysis detailing your home's value as well as a comparison with similar homes in the area
Home Values in the Area
Average Home Value in this Area
Purchase History
| Date | Buyer | Sale Price | Title Company |
|---|---|---|---|
| Bergeron Brennan T | $240,000 | None Available | |
| Sigurdsson Thor | $219,300 | -- | |
| Kcrm Properties Llc | $52,500 | -- | |
| Bank New York Mellon | $114,277 | -- |
Source: Public Records
Mortgage History
| Date | Status | Borrower | Loan Amount |
|---|---|---|---|
| Open | Bergeron Brennan T | $242,424 | |
| Previous Owner | Sigurdsson Thor | $208,335 |
Source: Public Records
Tax History Compared to Growth
Tax History
| Year | Tax Paid | Tax Assessment Tax Assessment Total Assessment is a certain percentage of the fair market value that is determined by local assessors to be the total taxable value of land and additions on the property. | Land | Improvement |
|---|---|---|---|---|
| 2024 | $1,310 | $20,880 | $3,940 | $16,940 |
| 2023 | $1,310 | $18,060 | $3,940 | $14,120 |
| 2022 | $1,047 | $18,060 | $3,940 | $14,120 |
| 2021 | $909 | $16,650 | $3,940 | $12,710 |
| 2020 | $1,494 | $18,060 | $3,940 | $14,120 |
| 2019 | $1,494 | $16,630 | $3,430 | $13,200 |
| 2018 | $1,423 | $15,840 | $3,270 | $12,570 |
| 2017 | $1,419 | $15,840 | $3,270 | $12,570 |
| 2015 | $546 | $15,085 | $3,110 | $11,975 |
| 2014 | $814 | $15,085 | $0 | $0 |
| 2013 | $815 | $15,085 | $0 | $0 |
Source: Public Records
Map
Nearby Homes
- 1402 Levee Dr
- 114 Angelle Cir
- 302 N Moss Dr
- 206 Angelle Dr
- 1408 Cottage Dr
- 208 Angelle Dr
- 222 Denning Dr
- 332 N Moss Dr
- 378 Shoal Dr
- 432 Southdown Blvd W
- 1230 Valhi Blvd
- 101 Valhi Blvd
- 209 Denning Dr
- 327 Shelby Claire Dr
- 503 S Moss Dr
- 129 Rue Saia
- 201 Rue Christe'
- 207 Marshall Dr
- 115 Bryce Ln
- 4916 Louisiana 311