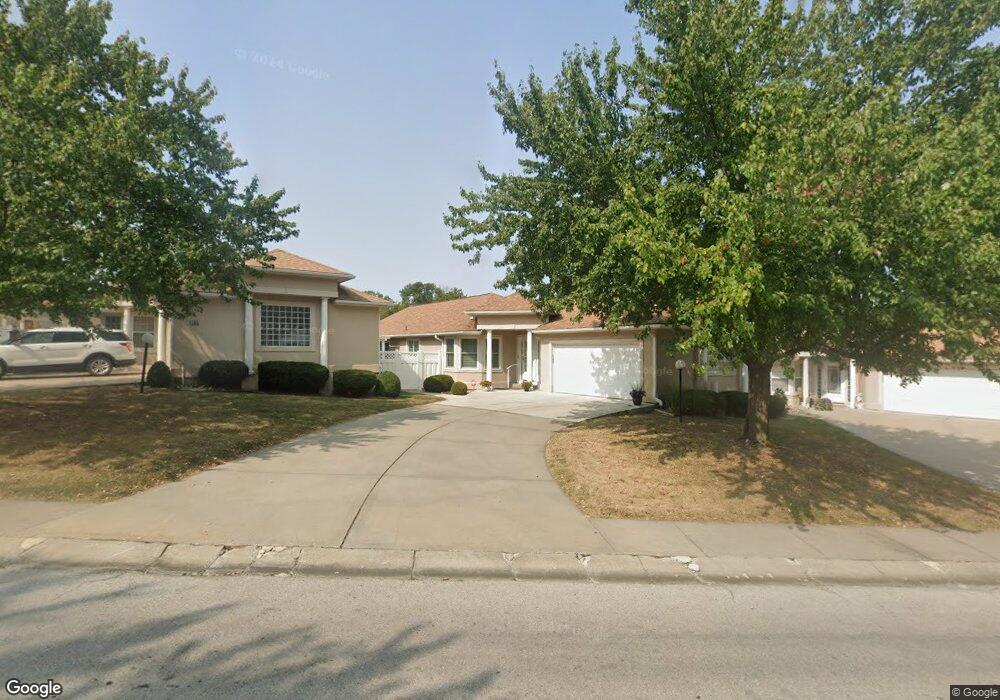
1309 NW North Ridge Dr Blue Springs, MO 64015
Estimated Value: $265,000 - $336,000
2
Beds
2
Baths
1,654
Sq Ft
$188/Sq Ft
Est. Value
About This Home
This home is located at 1309 NW North Ridge Dr, Blue Springs, MO 64015 and is currently estimated at $310,809, approximately $187 per square foot. 1309 NW North Ridge Dr is a home located in Jackson County with nearby schools including James Lewis Elementary School, Brittany Hill Middle School, and Blue Springs High School.
Ownership History
Date
Name
Owned For
Owner Type
Purchase Details
Closed on
Sep 25, 2017
Sold by
Tripp Brian P
Bought by
The William Glen Barnes & Darleen Marie
Current Estimated Value
Purchase Details
Closed on
Dec 23, 2016
Sold by
Spicer Ruby M
Bought by
Spicer Ruby M
Purchase Details
Closed on
Jun 18, 2004
Sold by
Lyne Robert J and Line Shirley A
Bought by
Spicer Ruby M
Purchase Details
Closed on
May 20, 2002
Sold by
Tim Davenport Construction Inc
Bought by
Lyne Robert J and Lyne Shirley A
Purchase Details
Closed on
Oct 2, 2001
Sold by
Bill House Excavating Co
Bought by
Tim Davenport Construction Inc
Home Financials for this Owner
Home Financials are based on the most recent Mortgage that was taken out on this home.
Original Mortgage
$150,000
Interest Rate
6.88%
Mortgage Type
Construction
Create a Home Valuation Report for This Property
The Home Valuation Report is an in-depth analysis detailing your home's value as well as a comparison with similar homes in the area
Home Values in the Area
Average Home Value in this Area
Purchase History
| Date | Buyer | Sale Price | Title Company |
|---|---|---|---|
| The William Glen Barnes & Darleen Marie | -- | None Available | |
| Spicer Ruby M | -- | None Available | |
| Spicer Ruby M | -- | Stewart | |
| Lyne Robert J | -- | -- | |
| Tim Davenport Construction Inc | -- | Stewart Title |
Source: Public Records
Mortgage History
| Date | Status | Borrower | Loan Amount |
|---|---|---|---|
| Previous Owner | Tim Davenport Construction Inc | $150,000 |
Source: Public Records
Tax History Compared to Growth
Tax History
| Year | Tax Paid | Tax Assessment Tax Assessment Total Assessment is a certain percentage of the fair market value that is determined by local assessors to be the total taxable value of land and additions on the property. | Land | Improvement |
|---|---|---|---|---|
| 2025 | $3,597 | $50,700 | $7,097 | $43,603 |
| 2024 | $3,528 | $44,088 | $1,706 | $42,382 |
| 2023 | $3,528 | $44,088 | $5,539 | $38,549 |
| 2022 | $4,008 | $44,270 | $4,313 | $39,957 |
| 2021 | $4,004 | $44,270 | $4,313 | $39,957 |
| 2020 | $3,439 | $38,674 | $4,313 | $34,361 |
| 2019 | $3,325 | $38,674 | $4,313 | $34,361 |
| 2018 | $3,295 | $36,892 | $4,458 | $32,434 |
| 2017 | $3,295 | $36,892 | $4,458 | $32,434 |
| 2016 | $3,055 | $34,295 | $4,009 | $30,286 |
| 2014 | $2,742 | $30,768 | $4,000 | $26,768 |
Source: Public Records
Map
Nearby Homes
- 813 NW North Ridge Ct
- 1513 NW Weatherstone Ct
- 1601 NW Weatherstone Ct
- 1113 NW Forest Dr
- 1000 NW Forest Dr
- 1501 NW 18th St
- 1109 NW Mock Ave
- 409 NW Locust Dr
- 2100 NW Parker Ct
- 2100 NW 12th St
- 804 NW Maynard St
- 908 NW Timber Oak Dr
- 2117 NW Parker Ct
- 0 NW Jefferson St
- 1400 NW Deer Run Trail
- 1201 NW Burr Oak Ct
- 2105 NW 5th St
- 1389 NW Jefferson Ct
- 1912 NW Manor Dr
- 280 NW Beau Dr
- 1401 NW North Ridge Dr
- 1305 NW North Ridge Dr
- 900 NW North Ridge Ct
- 1405 NW North Ridge Dr
- 904 NW North Ridge Ct
- 848 NW North Ridge Ct
- 1301 NW North Ridge Dr
- 844 NW North Ridge Ct
- 908 NW North Ridge Ct
- 1409 NW North Ridge Dr
- 840 NW North Ridge Ct
- 1300 NW North Ridge Dr
- 836 NW North Ridge Ct
- 941 NW North Ridge Ct
- 905 NW North Ridge Ct
- 901 NW North Ridge Ct
- 937 NW North Ridge Ct
- 909 NW North Ridge Ct
- 933 NW North Ridge Ct
- 849 NW North Ridge Ct