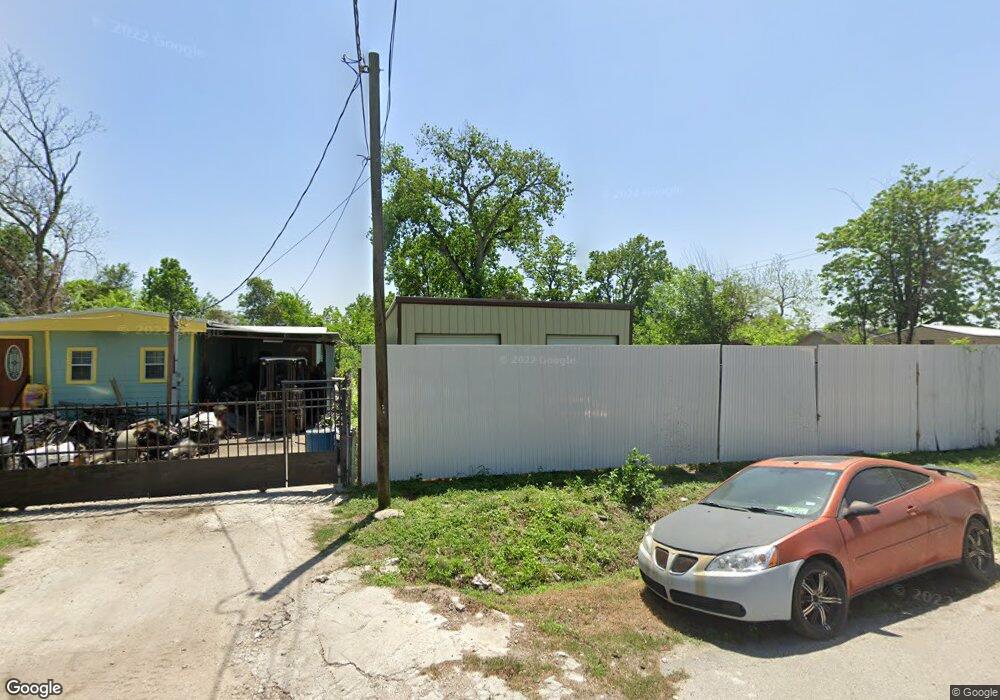
1309 Regena St Houston, TX 77039
Estimated Value: $171,000 - $695,000
2
Beds
1
Bath
816
Sq Ft
$531/Sq Ft
Est. Value
About This Home
This home is located at 1309 Regena St, Houston, TX 77039 and is currently estimated at $433,000, approximately $530 per square foot. 1309 Regena St is a home located in Harris County with nearby schools including Hinojosa EC/PK/K, Raymond Academy, and Grantham Academy.
Ownership History
Date
Name
Owned For
Owner Type
Purchase Details
Closed on
Jul 25, 2023
Sold by
Alcantar Antonio
Bought by
Figueroa Ricardo A
Current Estimated Value
Purchase Details
Closed on
Mar 24, 2016
Sold by
Castle Homes De Llc
Bought by
Martinez Linda C and Alcantar Antonio
Purchase Details
Closed on
Oct 7, 2014
Sold by
Villarreal Sandra A
Bought by
First Castle Homes De Llc
Purchase Details
Closed on
Aug 19, 2014
Sold by
United States Of America and Villarreal Sandra A
Bought by
Harris County and Lone Star College System
Purchase Details
Closed on
Dec 24, 1998
Sold by
American Custom Homes Inc
Bought by
Saldivar Jesus and Saldivar Maria
Home Financials for this Owner
Home Financials are based on the most recent Mortgage that was taken out on this home.
Original Mortgage
$74,455
Interest Rate
6.85%
Mortgage Type
FHA
Create a Home Valuation Report for This Property
The Home Valuation Report is an in-depth analysis detailing your home's value as well as a comparison with similar homes in the area
Home Values in the Area
Average Home Value in this Area
Purchase History
| Date | Buyer | Sale Price | Title Company |
|---|---|---|---|
| Figueroa Ricardo A | -- | None Listed On Document | |
| Martinez Linda C | -- | None Available | |
| First Castle Homes De Llc | $6,500 | None Available | |
| Harris County | -- | -- | |
| Harris County | -- | -- | |
| Saldivar Jesus | -- | Chicago Title |
Source: Public Records
Mortgage History
| Date | Status | Borrower | Loan Amount |
|---|---|---|---|
| Previous Owner | Saldivar Jesus | $74,455 | |
| Closed | Saldivar Jesus | $4,600 | |
| Closed | Martinez Linda C | $0 |
Source: Public Records
Tax History Compared to Growth
Tax History
| Year | Tax Paid | Tax Assessment Tax Assessment Total Assessment is a certain percentage of the fair market value that is determined by local assessors to be the total taxable value of land and additions on the property. | Land | Improvement |
|---|---|---|---|---|
| 2025 | $679 | $35,120 | $24,988 | $10,132 |
| 2024 | $679 | $35,120 | $24,988 | $10,132 |
| 2023 | $679 | $35,120 | $24,988 | $10,132 |
| 2022 | $465 | $22,626 | $12,494 | $10,132 |
| 2021 | $269 | $12,494 | $12,494 | $0 |
| 2020 | $284 | $12,494 | $12,494 | $0 |
| 2019 | $297 | $12,494 | $12,494 | $0 |
| 2018 | $135 | $9,371 | $9,371 | $0 |
| 2017 | $212 | $9,371 | $9,371 | $0 |
| 2016 | $212 | $9,371 | $9,371 | $0 |
| 2015 | $247 | $9,371 | $9,371 | $0 |
| 2014 | $247 | $12,494 | $12,494 | $0 |
Source: Public Records
Map
Nearby Homes
- 28351 W Hardy Rd
- 12969 W Hardy Rd
- 13113 Reeveston Rd
- 13610 Carmilenda St
- 822 Aldine Mail Route Rd
- 14215 Sweeney Rd
- 13530 Luthe Rd
- 1449 Mesquite St
- 904 Hill Rd
- 814 Isetta Ln
- 1450 Mesquite St
- 13635 Reeveston Rd
- 13310 Robertcrest St Unit B
- 12806 Bauman Rd
- 13819 Stoneshire St
- 1810 Connorvale Rd
- 511 Gulf Bank Rd Unit 5
- 1122 Havner Ln
- 726 Corvette Ct
- 0 Verhalen
- 1313 Regena St
- 12128 E Hardy Rd
- 12132 E Hardy Rd
- 1317 Regena St
- 1317 Regena St
- 12124 E Hardy Rd
- 1314 Regena St
- 1321 Regena St
- 1310 Regena St
- 1318 Regena St
- 1322 Regena St
- 1325 Regena St
- 12206 E Hardy Rd
- 1329 Regena St
- 12218 E Hardy Rd
- 0-0295 W Hardy Rd
- 12222 E Hardy Rd
- 12901 Hardy Tollroad
- 12835 Reeveston Rd
- 12831 Reeveston Rd