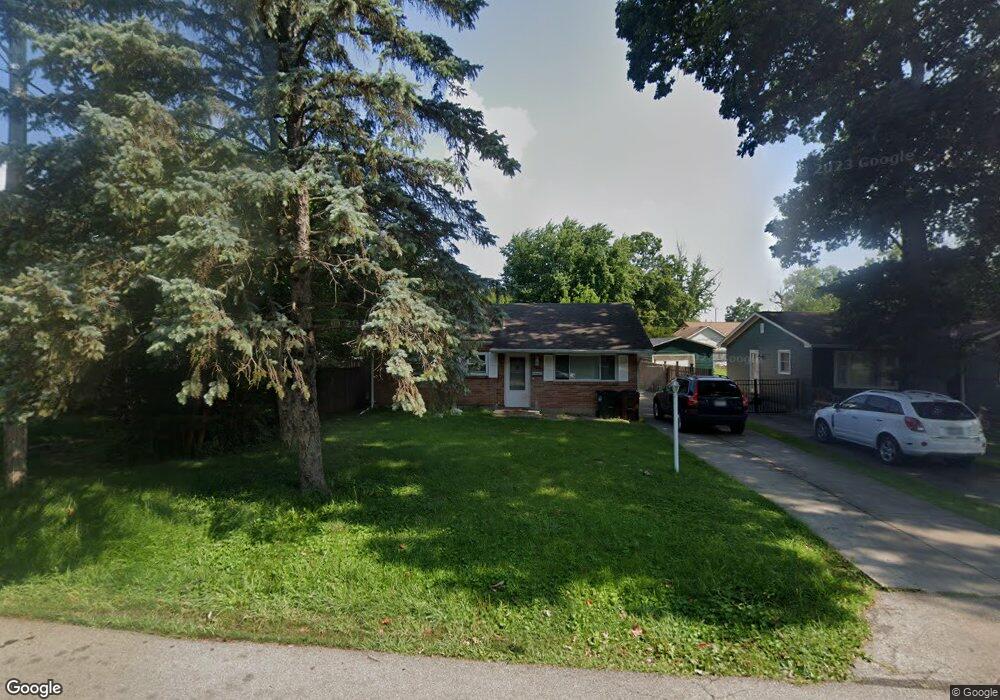
1309 Rochelle Ave Dayton, OH 45429
Estimated Value: $158,599 - $185,000
3
Beds
1
Bath
924
Sq Ft
$183/Sq Ft
Est. Value
About This Home
This home is located at 1309 Rochelle Ave, Dayton, OH 45429 and is currently estimated at $169,150, approximately $183 per square foot. 1309 Rochelle Ave is a home located in Montgomery County with nearby schools including John F. Kennedy Elementary School, Kettering Middle School, and Kettering Fairmont High School.
Ownership History
Date
Name
Owned For
Owner Type
Purchase Details
Closed on
Dec 8, 2010
Sold by
Secretary Of Veterans Affairs
Bought by
Baumer Properties Ltd
Current Estimated Value
Purchase Details
Closed on
Oct 7, 2010
Sold by
Weber Thomas M
Bought by
Secretary Of Veterans Affairs
Purchase Details
Closed on
Jun 29, 2007
Sold by
Cook Amy L
Bought by
Weber Thomas M
Home Financials for this Owner
Home Financials are based on the most recent Mortgage that was taken out on this home.
Original Mortgage
$95,900
Interest Rate
6.42%
Mortgage Type
VA
Purchase Details
Closed on
May 31, 2000
Sold by
Akers Bonnie B
Bought by
Cook Amy L
Home Financials for this Owner
Home Financials are based on the most recent Mortgage that was taken out on this home.
Original Mortgage
$68,400
Interest Rate
8.14%
Create a Home Valuation Report for This Property
The Home Valuation Report is an in-depth analysis detailing your home's value as well as a comparison with similar homes in the area
Home Values in the Area
Average Home Value in this Area
Purchase History
| Date | Buyer | Sale Price | Title Company |
|---|---|---|---|
| Baumer Properties Ltd | -- | Attorney | |
| Secretary Of Veterans Affairs | $48,000 | None Available | |
| Weber Thomas M | $93,900 | Attorney | |
| Cook Amy L | $72,000 | Summit Land Title Agency Inc |
Source: Public Records
Mortgage History
| Date | Status | Borrower | Loan Amount |
|---|---|---|---|
| Previous Owner | Weber Thomas M | $95,900 | |
| Previous Owner | Cook Amy L | $68,400 |
Source: Public Records
Tax History Compared to Growth
Tax History
| Year | Tax Paid | Tax Assessment Tax Assessment Total Assessment is a certain percentage of the fair market value that is determined by local assessors to be the total taxable value of land and additions on the property. | Land | Improvement |
|---|---|---|---|---|
| 2024 | $2,468 | $38,830 | $8,390 | $30,440 |
| 2023 | $2,468 | $38,830 | $8,390 | $30,440 |
| 2022 | $2,442 | $30,400 | $6,550 | $23,850 |
| 2021 | $2,263 | $30,400 | $6,550 | $23,850 |
| 2020 | $2,270 | $30,400 | $6,550 | $23,850 |
| 2019 | $1,997 | $23,620 | $5,960 | $17,660 |
| 2018 | $2,008 | $23,620 | $5,960 | $17,660 |
| 2017 | $1,854 | $23,620 | $5,960 | $17,660 |
| 2016 | $1,932 | $23,140 | $5,960 | $17,180 |
| 2015 | $1,849 | $23,140 | $5,960 | $17,180 |
| 2014 | $1,849 | $23,140 | $5,960 | $17,180 |
| 2012 | -- | $22,650 | $5,950 | $16,700 |
Source: Public Records
Map
Nearby Homes
- 1328 Willowdale Ave
- 4244 Flowerdale Ave
- 4307 Meadowcroft Rd
- 1033 Carlo Dr
- 1013 Swango Dr
- 1008 Rio Ln
- 1105 Greenridge Dr
- 4640 Marshall Rd
- 1310 Partridge Run Cir Unit 1310
- 3872 Maryknoll Dr
- 959 Kimberly Dr
- 3725 Claybourne Rd
- 4850 Foxdale Dr Unit 4850
- 804 Lovetta Dr
- 1049 Georgian Dr
- 791 Willowdale Ave
- 2021 Stayman Dr
- 3736 Valleywood Dr
- 3822 Milford Dr
- 4817 Ackerman Blvd
- 1313 Rochelle Ave
- 1301 Rochelle Ave
- 4224 Marshall Rd
- 1317 Rochelle Ave
- 4220 Marshall Rd
- 1304 Rose Bower Ave
- 1321 Rochelle Ave
- 1308 Rose Bower Ave
- 4300 Marshall Rd
- 1304 Rochelle Ave
- 4216 Marshall Rd
- 1312 Rose Bower Ave
- 1329 Rochelle Ave
- 4304 Marshall Rd
- 1312 Rochelle Ave
- 1316 Rochelle Ave
- 1316 Rose Bower Ave
- 4308 Marshall Rd
- 4221 Marshall Rd
- 1320 Rochelle Ave