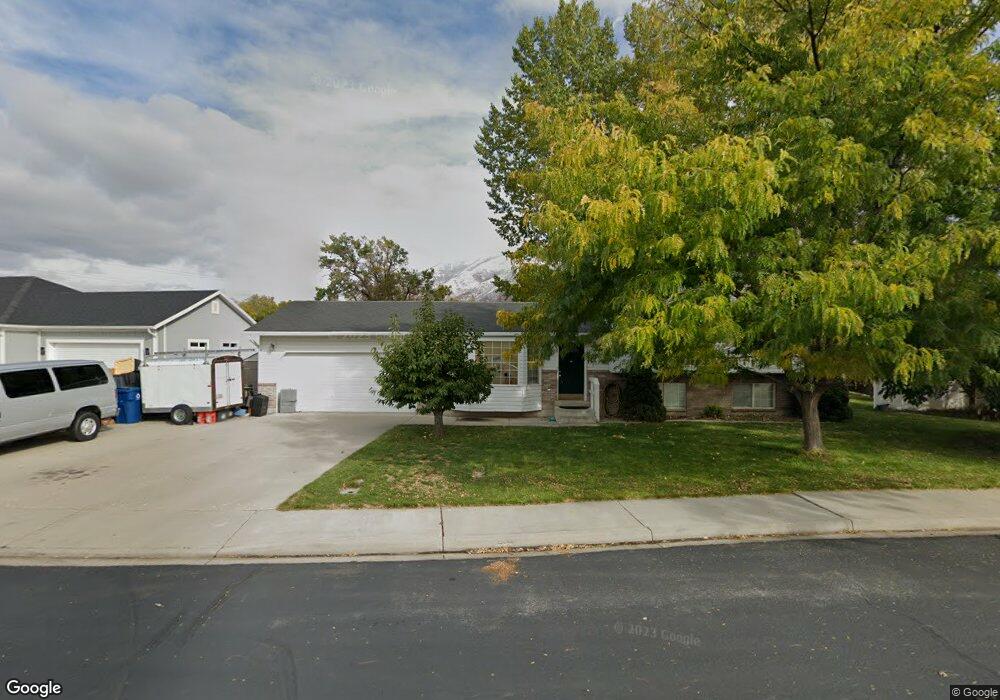
1309 S 2700 E Spanish Fork, UT 84660
Estimated Value: $490,000 - $507,000
4
Beds
2
Baths
1,850
Sq Ft
$268/Sq Ft
Est. Value
About This Home
This home is located at 1309 S 2700 E, Spanish Fork, UT 84660 and is currently estimated at $496,514, approximately $268 per square foot. 1309 S 2700 E is a home located in Utah County with nearby schools including Spanish Oaks Elementary School, Diamond Fork Junior High School, and Mapleton Junior High School.
Ownership History
Date
Name
Owned For
Owner Type
Purchase Details
Closed on
Jun 24, 2010
Sold by
Parke Becky
Bought by
Lowe David and Lowe Amber
Current Estimated Value
Home Financials for this Owner
Home Financials are based on the most recent Mortgage that was taken out on this home.
Original Mortgage
$165,082
Outstanding Balance
$107,332
Interest Rate
4.37%
Mortgage Type
FHA
Estimated Equity
$389,182
Purchase Details
Closed on
Feb 28, 2008
Sold by
Lovell Randy Jay and Lovell Kim
Bought by
Parke Becky
Home Financials for this Owner
Home Financials are based on the most recent Mortgage that was taken out on this home.
Original Mortgage
$218,789
Interest Rate
5.65%
Mortgage Type
FHA
Purchase Details
Closed on
Sep 25, 2000
Sold by
Flake Ronald J and Flake Melinda M
Bought by
Lovell Randy Jay and Lovell Kim
Home Financials for this Owner
Home Financials are based on the most recent Mortgage that was taken out on this home.
Original Mortgage
$118,800
Interest Rate
10.5%
Create a Home Valuation Report for This Property
The Home Valuation Report is an in-depth analysis detailing your home's value as well as a comparison with similar homes in the area
Home Values in the Area
Average Home Value in this Area
Purchase History
| Date | Buyer | Sale Price | Title Company |
|---|---|---|---|
| Lowe David | -- | Premium Title | |
| Parke Becky | -- | First American Pinehurst | |
| Lovell Randy Jay | -- | Pro Title & Escrow Inc |
Source: Public Records
Mortgage History
| Date | Status | Borrower | Loan Amount |
|---|---|---|---|
| Open | Lowe David | $165,082 | |
| Previous Owner | Parke Becky | $218,789 | |
| Previous Owner | Lovell Randy Jay | $118,800 | |
| Closed | Lovell Randy Jay | $14,000 |
Source: Public Records
Tax History Compared to Growth
Tax History
| Year | Tax Paid | Tax Assessment Tax Assessment Total Assessment is a certain percentage of the fair market value that is determined by local assessors to be the total taxable value of land and additions on the property. | Land | Improvement |
|---|---|---|---|---|
| 2025 | $2,236 | $246,235 | $199,500 | $248,200 |
| 2024 | $2,236 | $230,505 | $0 | $0 |
| 2023 | $2,273 | $234,520 | $0 | $0 |
| 2022 | $2,251 | $227,810 | $0 | $0 |
| 2021 | $1,874 | $303,400 | $119,200 | $184,200 |
| 2020 | $1,773 | $279,000 | $108,400 | $170,600 |
| 2019 | $1,563 | $258,800 | $90,300 | $168,500 |
| 2018 | $1,447 | $231,700 | $85,200 | $146,500 |
| 2017 | $1,385 | $119,130 | $0 | $0 |
| 2016 | $1,290 | $109,560 | $0 | $0 |
| 2015 | $1,182 | $99,165 | $0 | $0 |
| 2014 | $1,050 | $88,385 | $0 | $0 |
Source: Public Records
Map
Nearby Homes
- 2834 E 1320 S
- 3170 E 1089 S
- 1613 S 3170 E
- 2748 E 1060 S
- 2746 E 1060 S
- 2744 E 1060 S
- 1072 S 2760 E
- 1082 S 2810 E
- 1068 S 2760 E
- 2747 E 1060 S
- 2745 E 1060 S
- 2743 E 1060 S
- 2741 E 1060 S
- 2947 E 1300 S
- 2972 E Canyon Meadows Dr Unit 335
- 2984 E Canyon Meadows Dr
- 1013 S 2740 E
- 1003 S 2740 E
- 998 S 2720 E
- 3031 E Canyon Meadows Dr Unit 314