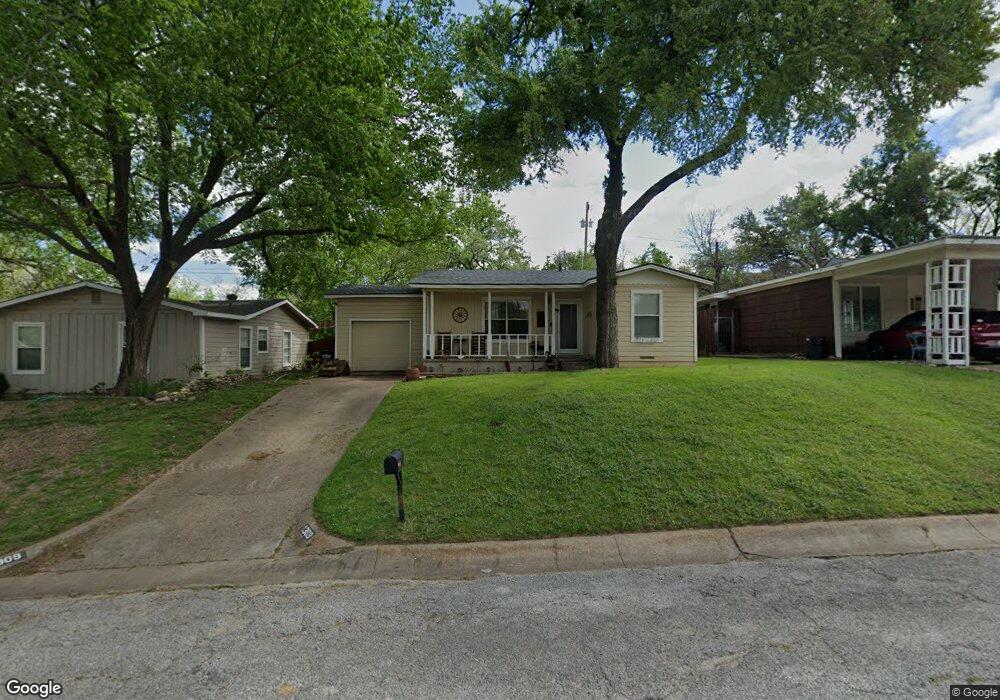
1309 S Lamar St Weatherford, TX 76086
Estimated Value: $218,861 - $258,000
2
Beds
1
Bath
1,089
Sq Ft
$217/Sq Ft
Est. Value
About This Home
This home is located at 1309 S Lamar St, Weatherford, TX 76086 and is currently estimated at $235,965, approximately $216 per square foot. 1309 S Lamar St is a home located in Parker County with nearby schools including Curtis Elementary School, Hall Middle School, and Weatherford High School.
Ownership History
Date
Name
Owned For
Owner Type
Purchase Details
Closed on
Aug 10, 2020
Sold by
Cronin Joe R and Cronin Joseph R
Bought by
Coats Barbara
Current Estimated Value
Home Financials for this Owner
Home Financials are based on the most recent Mortgage that was taken out on this home.
Original Mortgage
$148,410
Outstanding Balance
$131,893
Interest Rate
3.1%
Mortgage Type
New Conventional
Estimated Equity
$104,072
Purchase Details
Closed on
Sep 27, 2019
Sold by
Carlile Reeves Kendra L and Reeves Kevin W
Bought by
Cronin Joe R
Purchase Details
Closed on
May 11, 2000
Sold by
Keeney Lynne Ellis
Bought by
Carlile Kendra L
Purchase Details
Closed on
Jun 19, 1997
Bought by
Carlile Kendra L
Purchase Details
Closed on
Nov 11, 1996
Bought by
Carlile Kendra L
Purchase Details
Closed on
Jul 1, 1994
Bought by
Carlile Kendra L
Purchase Details
Closed on
Jan 1, 1901
Bought by
Carlile Kendra L
Create a Home Valuation Report for This Property
The Home Valuation Report is an in-depth analysis detailing your home's value as well as a comparison with similar homes in the area
Home Values in the Area
Average Home Value in this Area
Purchase History
| Date | Buyer | Sale Price | Title Company |
|---|---|---|---|
| Coats Barbara | -- | None Available | |
| Cronin Joe R | -- | None Available | |
| Carlile Kendra L | -- | -- | |
| Carlile Kendra L | -- | -- | |
| Carlile Kendra L | -- | -- | |
| Carlile Kendra L | -- | -- | |
| Carlile Kendra L | -- | -- |
Source: Public Records
Mortgage History
| Date | Status | Borrower | Loan Amount |
|---|---|---|---|
| Open | Coats Barbara | $148,410 |
Source: Public Records
Tax History Compared to Growth
Tax History
| Year | Tax Paid | Tax Assessment Tax Assessment Total Assessment is a certain percentage of the fair market value that is determined by local assessors to be the total taxable value of land and additions on the property. | Land | Improvement |
|---|---|---|---|---|
| 2025 | $969 | $150,282 | -- | -- |
| 2024 | $969 | $136,620 | -- | -- |
| 2023 | $969 | $206,230 | $40,000 | $166,230 |
| 2022 | $2,505 | $112,910 | $20,000 | $92,910 |
| 2021 | $2,712 | $112,910 | $20,000 | $92,910 |
| 2020 | $2,316 | $95,870 | $20,000 | $75,870 |
| 2019 | $2,448 | $95,870 | $20,000 | $75,870 |
| 2018 | $2,170 | $84,580 | $20,000 | $64,580 |
| 2017 | $2,225 | $84,580 | $20,000 | $64,580 |
| 2016 | $1,942 | $73,820 | $20,000 | $53,820 |
| 2015 | $1,533 | $73,820 | $20,000 | $53,820 |
| 2014 | $1,606 | $72,290 | $20,000 | $52,290 |
Source: Public Records
Map
Nearby Homes
- 209 S Hill Dr
- 423 Live Oak Ln
- 1220 S Brazos St
- 1213 S Lamar St
- 323 W Rentz St
- 102 Bob White Ave
- 208 W Park Ave
- 1009 S Brazos St
- 918 El Dorado St
- 905 Eldorado St
- 905 S Lamar St
- 904 S Brazos St
- 122 Rachel Rd
- 824 S Alamo St
- 819 Norton St
- 902 S Waco St
- 1816 Barberry
- 741 Nandina Rd
- 1813 Barberry Way
- 213 Jefferson St
- 106 W Ridge St
- 1307 S Lamar St
- 112 W Ridge St
- 1311 S Lamar St
- 1306 S Lamar St
- 1305 S Lamar St
- 1313 S Lamar St
- 136 W Ridge St
- 1304 S Lamar St
- 1312 S Lamar St
- 103 W Ridge Rd
- 1315 S Lamar St
- 111 Edge Hill Terrace
- 115 S Hill Dr
- 104 W Ridge Rd
- 113 S Hill Dr
- 1302 S Lamar St
- 115 Edge Hill Terrace
- 105 W Ridge Rd
- 111 S Hill Dr