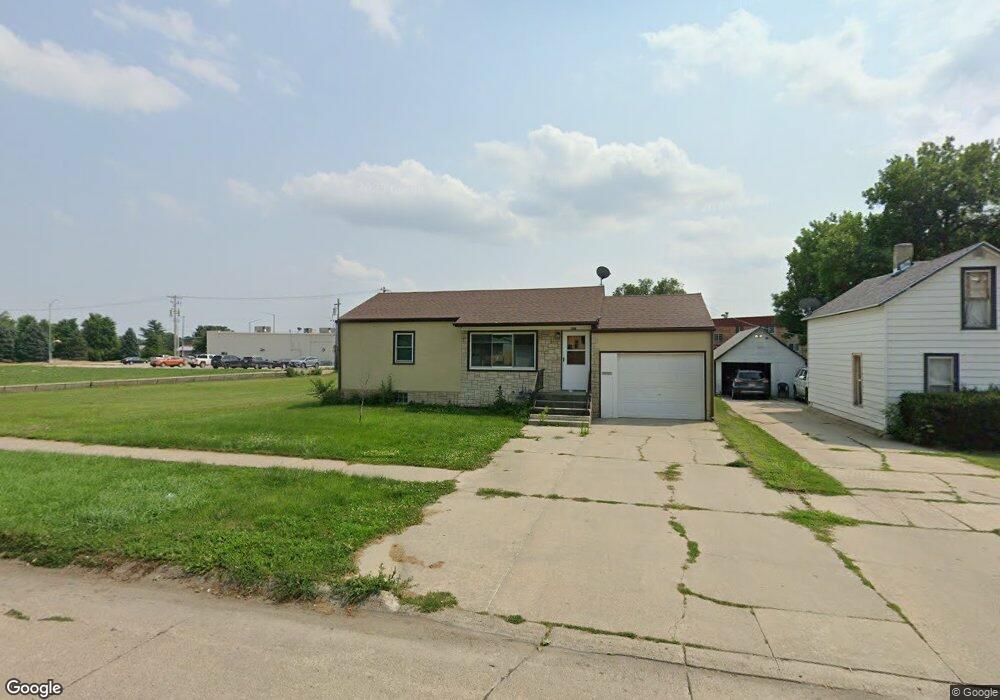
1309 Taylor Ave Norfolk, NE 68701
Estimated Value: $171,000 - $196,982
2
Beds
2
Baths
726
Sq Ft
$255/Sq Ft
Est. Value
About This Home
This home is located at 1309 Taylor Ave, Norfolk, NE 68701 and is currently estimated at $185,246, approximately $255 per square foot. 1309 Taylor Ave is a home located in Madison County with nearby schools including Norfolk Senior High School, Christ Lutheran School, and Keystone Christian Academy.
Ownership History
Date
Name
Owned For
Owner Type
Purchase Details
Closed on
Aug 24, 2022
Sold by
Mccallum Properties Llc
Bought by
Painter Richard L
Current Estimated Value
Home Financials for this Owner
Home Financials are based on the most recent Mortgage that was taken out on this home.
Original Mortgage
$145,500
Outstanding Balance
$139,105
Interest Rate
5.51%
Mortgage Type
New Conventional
Estimated Equity
$46,141
Purchase Details
Closed on
Mar 25, 2019
Sold by
Pospisil Steven James
Bought by
Mccallum Properties Llc
Purchase Details
Closed on
Apr 15, 2005
Sold by
Wolfe Dale L and Wolfe Carol J
Bought by
Pospisil Steven J
Home Financials for this Owner
Home Financials are based on the most recent Mortgage that was taken out on this home.
Original Mortgage
$38,000
Interest Rate
5.93%
Mortgage Type
New Conventional
Create a Home Valuation Report for This Property
The Home Valuation Report is an in-depth analysis detailing your home's value as well as a comparison with similar homes in the area
Home Values in the Area
Average Home Value in this Area
Purchase History
| Date | Buyer | Sale Price | Title Company |
|---|---|---|---|
| Painter Richard L | $150,000 | American Title | |
| Mccallum Properties Llc | $115,000 | American Title And Escrow Co | |
| Pospisil Steven J | $60,000 | -- |
Source: Public Records
Mortgage History
| Date | Status | Borrower | Loan Amount |
|---|---|---|---|
| Open | Painter Richard L | $145,500 | |
| Previous Owner | Pospisil Steven J | $38,000 |
Source: Public Records
Tax History Compared to Growth
Tax History
| Year | Tax Paid | Tax Assessment Tax Assessment Total Assessment is a certain percentage of the fair market value that is determined by local assessors to be the total taxable value of land and additions on the property. | Land | Improvement |
|---|---|---|---|---|
| 2024 | $1,717 | $137,872 | $19,531 | $118,341 |
| 2023 | $2,315 | $125,193 | $19,531 | $105,662 |
| 2022 | $2,111 | $113,872 | $19,531 | $94,341 |
| 2021 | $1,920 | $103,764 | $19,531 | $84,233 |
| 2020 | $1,747 | $94,739 | $19,531 | $75,208 |
| 2019 | $1,656 | $86,681 | $19,531 | $67,150 |
| 2018 | $1,603 | $85,348 | $21,428 | $63,920 |
| 2017 | $1,539 | $81,803 | $21,428 | $60,375 |
| 2016 | $1,500 | $79,594 | $8,579 | $71,015 |
| 2015 | $1,500 | $79,594 | $8,579 | $71,015 |
| 2014 | $1,479 | $76,212 | $8,579 | $67,633 |
| 2013 | $1,439 | $71,787 | $8,579 | $63,208 |
Source: Public Records
Map
Nearby Homes
- 1312 Hayes Ave
- 809 S 14th St
- 1313 W Park Ave
- 103 S 13th Place
- 706 Columbia St
- 2300 Taylor Ave
- 2308 Taylor Ave
- See Legal
- 404 S 12th St
- 1208 W Phillip Ave
- 3307 W Michigan Ave
- 3206 W Michigan Ave
- 3205 W Michigan Ave
- 3306 W Michigan Ave
- 602 S 10th St
- 207 S 17th St
- 1809 W Taylor Ave
- 705 S 10th St
- 1407 Koenigstein Ave
- 3302 Stonebrooke Ln
- 1309 W Taylor
- 1307 Taylor Ave
- 1313 Taylor Ave
- 1315 Taylor Ave
- 600 S 13th St
- 1319 Taylor Ave
- 1314 W Pasewalk Ave
- 1308 Taylor Ave
- 1312 Taylor Ave
- 1306 Taylor Ave
- 1321 Taylor Ave
- 1314 Taylor Ave
- 603 S 14th St
- 607 S 14th St
- 609 S 14th St
- 1318 Taylor Ave
- 1311 Hayes Ave
- 1315 Hayes Ave
- 1309 Hayes Ave
- 1317 Hayes Ave