
Highlights
- Gated Community
- Home Office
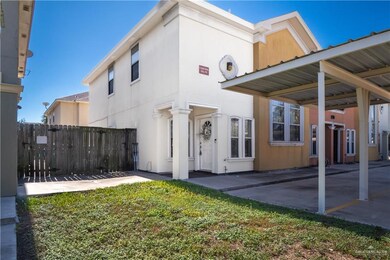
- Patio
- Bonus Room
- Walk-In Closet
- Laundry closet
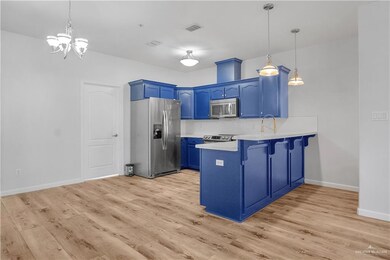
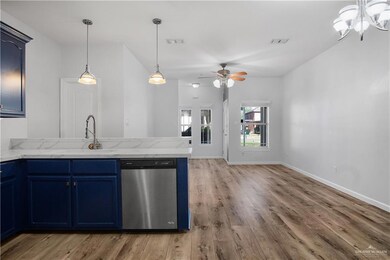
About This Home
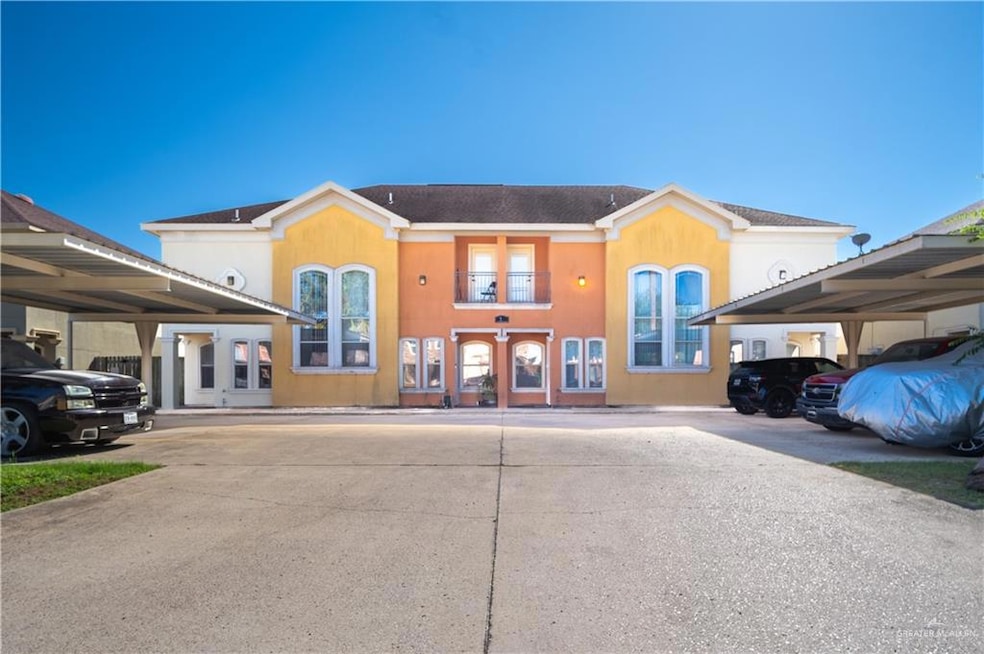
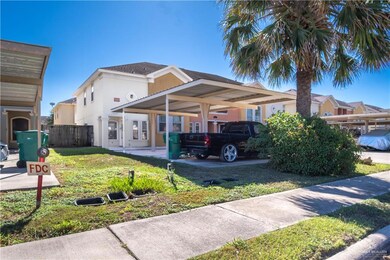
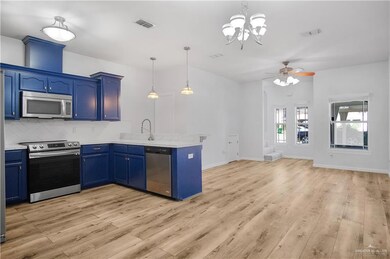
Move in ready! Beautifully remodeled, spacious condo with 3 bedrooms, 2.5 bathrooms and a bonus room/study. The bright open-concept living area on the first floor features new flooring and fully updated modern kitchen with stainless steel appliances. The spacious bedrooms upstairs offer privacy and comfort, with en-suite bathrooms and large closets. This corner unit has a large fenced patio and 2 covered parking spaces. Located just 5 minutes from the expressway, and in close proximity to the McAllen business district and Edinburg hospital district, this prime location is ideal. Schedule a showing today!
Condo Details
Home Type
- Condominium
Year Built
- Built in 2007
Interior Spaces
- 1,332 Sq Ft Home
- 2-Story Property
- Ceiling Fan
- Home Office
- Bonus Room
Bedrooms and Bathrooms
- 3 Bedrooms
- Walk-In Closet
Laundry
- Laundry closet
- Washer and Dryer Hookup
Home Security
Parking
- 2 Carport Spaces
- No Garage
Schools
- Arnold Elementary School
- Lbj Middle School
- Psja North High School
Additional Features
- Patio
- Central Heating and Cooling System
Listing and Financial Details
- Security Deposit $1,375
- Property Available on 11/3/25
- Tenant pays for electricity, water
- 12 Month Lease Term
- $40 Application Fee
- Assessor Parcel Number S677700000000A00
Community Details
Overview
- Property has a Home Owners Association
- Sugar Two Condominiums Subdivision
Pet Policy
- No Pets Allowed
Security
- Gated Community
- Fire and Smoke Detector
Map
Property History
| Date | Event | Price | List to Sale | Price per Sq Ft |
|---|---|---|---|---|
| 02/10/2026 02/10/26 | Price Changed | $1,325 | -3.6% | $1 / Sq Ft |
| 11/20/2025 11/20/25 | Price Changed | $1,375 | -5.2% | $1 / Sq Ft |
| 11/01/2025 11/01/25 | For Rent | $1,450 | -- | -- |
Source: Greater McAllen Association of REALTORS®
MLS Number: 485944
APN: S6777-00-000-000A-00
Disclaimer: Certain information contained herein is derived from information provided by parties other than Homes.com. All information provided is deemed reliable, but is not guaranteed to be accurate and should be independently verified.
![]() The data relating to real estate for sale on this web site comes in part from the Internet Data exchange (“IDX”) program of Greater McAllen Association of Realtors. IDX information is provided exclusively for consumers' personal, non-commercial use and may not be used for any purpose other than to identify prospective properties consumers may be interested in purchasing.
The data relating to real estate for sale on this web site comes in part from the Internet Data exchange (“IDX”) program of Greater McAllen Association of Realtors. IDX information is provided exclusively for consumers' personal, non-commercial use and may not be used for any purpose other than to identify prospective properties consumers may be interested in purchasing.
Information deemed reliable but not guaranteed.
Copyright 2026 Greater McAllen Association of Realtors. All rights reserved.
- 1309 W Fig Ave
- 1309 W Fig Ave Unit C
- 1402 W Kiwi Ave
- 1402 W Fig Ave
- 1208 W Fig Ave
- 918 W Minnesota Rd
- 1105 Wesley St
- 01 W Minnesota Rd
- 00 W Minnesota Rd
- 1201 Bette St
- 1007 Wesley St
- 800 Wesley St
- 1005 Wesley St
- 806 Bette St
- 1205 W Nolana Loop
- 908 W Iroquois Ave
- 5605 N Sugar Rd
- 4901 N Winona Dr
- 5701 N Sugar Rd
- 4905 N Dahlia St
- 1309 W Fig Ave Unit C
- 1306 W Kiwi Ave Unit 1
- 1306 W Kiwi Ave Unit 1
- 1306 W Kiwi Ave
- 1304 W Kiwi Unit 3
- 1304 W Kiwi Unit 2
- 1403 W Kiwi Unit 1
- 1304 W Fig Ave
- 1408 W Fig Ave Unit 3
- 1409 W Kiwi Unit 2
- 1503 W Kiwi Ave Unit 1
- 1206 W Fig Ave Unit 3
- 1204 W Fig Ave Unit 4
- 1203 W Fig Ave
- 1203 W Fig Ave
- 912 W Cheyenne Ave
- 5000 N Jackson Rd
- 5007 N Winona Dr Unit 3
- 4901 N Winona Dr Unit 3
- 4902 N Crown Point Unit 3

Ask me questions while you tour the home.