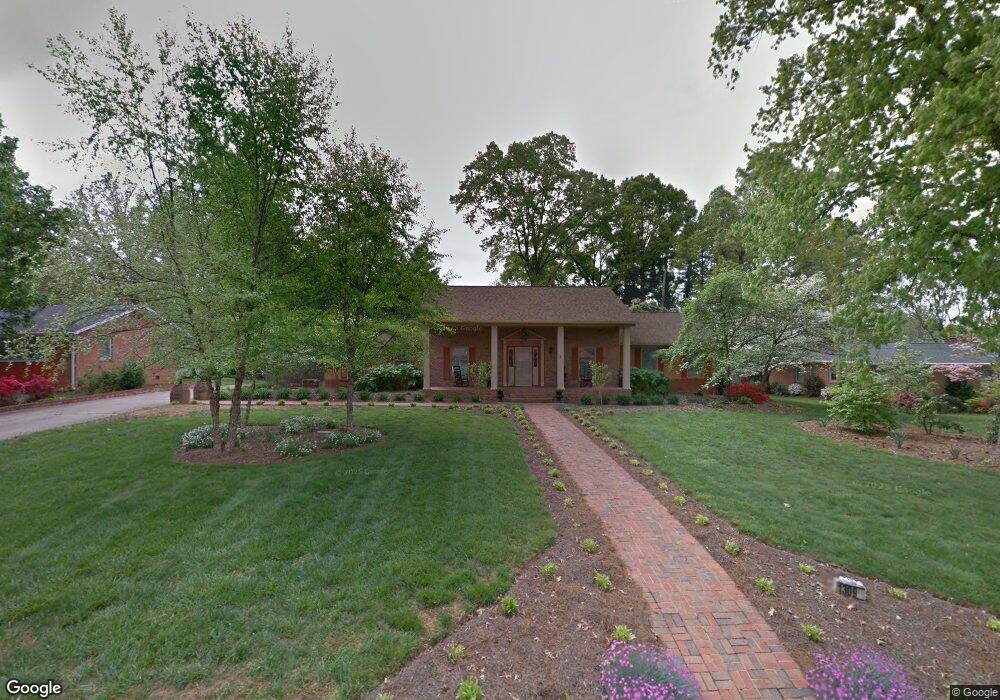
1309 Wesson Rd Shelby, NC 28152
Estimated Value: $342,000 - $416,150
Studio
--
Bath
3,697
Sq Ft
$103/Sq Ft
Est. Value
About This Home
This home is located at 1309 Wesson Rd, Shelby, NC 28152 and is currently estimated at $380,288, approximately $102 per square foot. 1309 Wesson Rd is a home located in Cleveland County with nearby schools including James Love Elementary School, Shelby Middle School, and Shelby High School.
Ownership History
Date
Name
Owned For
Owner Type
Purchase Details
Closed on
Mar 25, 2021
Sold by
Hawkins Robert K and Hawkins Freida A
Bought by
Howard Shauna
Current Estimated Value
Home Financials for this Owner
Home Financials are based on the most recent Mortgage that was taken out on this home.
Original Mortgage
$208,050
Outstanding Balance
$186,597
Interest Rate
2.73%
Mortgage Type
New Conventional
Estimated Equity
$193,691
Purchase Details
Closed on
Jan 16, 2015
Sold by
Vaughn Michael A and Barham John H
Bought by
Schlesinger Louis and Cline Christine N
Home Financials for this Owner
Home Financials are based on the most recent Mortgage that was taken out on this home.
Original Mortgage
$115,000
Interest Rate
3.98%
Mortgage Type
New Conventional
Create a Home Valuation Report for This Property
The Home Valuation Report is an in-depth analysis detailing your home's value as well as a comparison with similar homes in the area
Home Values in the Area
Average Home Value in this Area
Purchase History
| Date | Buyer | Sale Price | Title Company |
|---|---|---|---|
| Howard Shauna | $219,000 | None Listed On Document | |
| Schlesinger Louis | $145,000 | None Available |
Source: Public Records
Mortgage History
| Date | Status | Borrower | Loan Amount |
|---|---|---|---|
| Open | Howard Shauna | $208,050 | |
| Previous Owner | Schlesinger Louis | $115,000 |
Source: Public Records
Tax History
| Year | Tax Paid | Tax Assessment Tax Assessment Total Assessment is a certain percentage of the fair market value that is determined by local assessors to be the total taxable value of land and additions on the property. | Land | Improvement |
|---|---|---|---|---|
| 2025 | $3,940 | $396,010 | $24,300 | $371,710 |
| 2024 | $3,007 | $247,462 | $18,225 | $229,237 |
| 2023 | $1,387 | $187,459 | $18,225 | $169,234 |
| 2022 | $2,272 | $187,459 | $18,225 | $169,234 |
| 2021 | $2,284 | $187,459 | $18,225 | $169,234 |
| 2020 | $1,567 | $124,315 | $17,010 | $107,305 |
| 2019 | $1,567 | $124,315 | $17,010 | $107,305 |
| 2018 | $1,565 | $124,315 | $17,010 | $107,305 |
| 2017 | $1,524 | $124,315 | $17,010 | $107,305 |
| 2016 | $1,532 | $124,315 | $17,010 | $107,305 |
| 2015 | $1,948 | $167,053 | $18,225 | $148,828 |
| 2014 | $1,948 | $167,053 | $18,225 | $148,828 |
Source: Public Records
Map
Nearby Homes
- 697 Branton Dr
- 420 Stroud Rd
- 627 Tina Dr
- 1303 Hunt St
- 1303 W Dixon Blvd
- 1317 Wyanoke Ave
- 1405 Hubbard Terrace
- 901 W Elm St
- 905a Linney Ln
- 900 Linney Ln
- 901 Linney Ln
- 412 Franklin Ave
- 409 Gold St
- 809 Howard St
- 1325 Eastview Extension
- 728 Blanton St
- 1000 W Sumter St
- 912 W Sumter St
- 725 W Graham St
- 603 Calvary St
- 1311 Wesson Rd
- 1307 Wesson Rd
- 1304 Hammock Ave
- 1302 Hammock Ave
- 1306 Hammock Ave
- 1313 Wesson Rd
- 1305 Wesson Rd
- 1308 Wesson Rd
- 1300 Hammock Ave Unit 7
- 1300 Hammock Ave
- 1306 Wesson Rd
- 1308 Hammock Ave
- 1315 Wesson Rd
- 1310 Wesson Rd
- 1310 Hammock Ave
- 1312 Wesson Rd
- 1304 Wesson Rd
- 1303 Hammock Ave
- 1305 Hammock Ave
- 1301 Hammock Ave
Your Personal Tour Guide
Ask me questions while you tour the home.