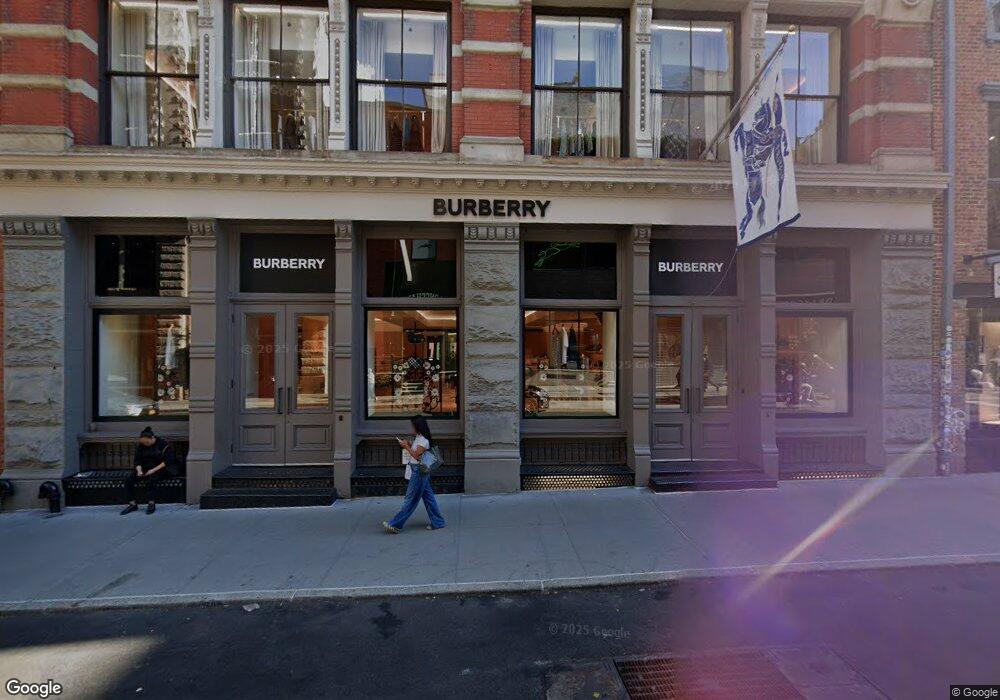
131-133 Spring St New York, NY 10012
SoHo Neighborhood
--
Bed
--
Bath
57,311
Sq Ft
9,627
Sq Ft Lot
About This Home
This home is located at 131-133 Spring St, New York, NY 10012. 131-133 Spring St is a home located in New York County with nearby schools including P.S. 3 Charrette School, Middle School 297, and Clinton School.
Ownership History
Date
Name
Owned For
Owner Type
Purchase Details
Closed on
Jul 2, 2015
Sold by
131 Spring Owner Llc and % Sl Green Realty Corp
Bought by
131 Spring Member Llc
Home Financials for this Owner
Home Financials are based on the most recent Mortgage that was taken out on this home.
Original Mortgage
$111,453,010
Interest Rate
4.08%
Mortgage Type
Commercial
Purchase Details
Closed on
Dec 28, 2012
Sold by
Willspring Holdings Llc
Bought by
131 Spring Owner Llc
Purchase Details
Closed on
Jun 14, 2006
Sold by
Spring Street Associates L P and Gallet Dreyer %
Bought by
Willspring Holdings Llc
Home Financials for this Owner
Home Financials are based on the most recent Mortgage that was taken out on this home.
Original Mortgage
$26,567,545
Interest Rate
6.58%
Mortgage Type
Commercial
Create a Home Valuation Report for This Property
The Home Valuation Report is an in-depth analysis detailing your home's value as well as a comparison with similar homes in the area
Home Values in the Area
Average Home Value in this Area
Purchase History
| Date | Buyer | Sale Price | Title Company |
|---|---|---|---|
| 131 Spring Member Llc | $222,200,000 | -- | |
| 131 Spring Owner Llc | $122,300,000 | -- | |
| Willspring Holdings Llc | $46,000,000 | -- |
Source: Public Records
Mortgage History
| Date | Status | Borrower | Loan Amount |
|---|---|---|---|
| Previous Owner | 131 Spring Member Llc | $111,453,010 | |
| Previous Owner | Willspring Holdings Llc | $26,567,545 |
Source: Public Records
Tax History Compared to Growth
Tax History
| Year | Tax Paid | Tax Assessment Tax Assessment Total Assessment is a certain percentage of the fair market value that is determined by local assessors to be the total taxable value of land and additions on the property. | Land | Improvement |
|---|---|---|---|---|
| 2025 | $3,620,271 | $33,995,810 | $2,250,000 | $31,745,810 |
| 2024 | $3,620,271 | $34,179,300 | $2,250,000 | $31,929,300 |
| 2023 | $3,784,346 | $35,547,120 | $2,250,000 | $33,297,120 |
| 2022 | $1,896,262 | $21,682,800 | $1,125,000 | $20,557,800 |
| 2021 | $1,639,021 | $15,326,550 | $1,125,000 | $14,201,550 |
| 2020 | $1,467,844 | $19,453,950 | $1,125,000 | $18,328,950 |
| 2019 | $1,193,688 | $15,975,900 | $1,125,000 | $14,850,900 |
| 2018 | $985,579 | $15,718,050 | $1,125,000 | $14,593,050 |
| 2017 | $781,086 | $11,780,100 | $1,125,000 | $10,655,100 |
| 2016 | $653,893 | $6,723,900 | $1,125,000 | $5,598,900 |
| 2015 | $225,492 | $6,057,450 | $1,125,000 | $4,932,450 |
| 2014 | $225,492 | $5,460,300 | $1,125,000 | $4,335,300 |
Source: Public Records
Map
Nearby Homes
- 100 Wooster St Unit 4
- 92 Greene St Unit 4
- 111 Wooster St Unit 4B
- 111 Wooster St Unit PHC
- 109 Greene St Unit 5A
- 106 Spring St Unit 3S
- 121 Mercer St Unit 4
- 419 W Broadway Unit 4
- 112 Prince St Unit 3
- 63 Greene St Unit 4DLOFT
- 63 Greene St Unit 2E
- 63 Greene St Unit PHA
- 393 W Broadway Unit 4WB
- 393 W Broadway Unit COMMERCIAL
- 99 Spring St Unit PH 6
- 99 Spring St Unit PH
- 100 Prince St Unit 5W
- 165 Spring St Unit 5W
- 114 Mercer St Unit 5THFLOOR
- 114 Mercer St Unit 2
- 129 Spring St
- 135-137 Spring St
- 89 Greene St Unit 5
- 89 Greene St Unit 4
- 89 Greene St Unit 3
- 89 Greene St Unit 2
- 89 Greene St Unit 1CELA
- 89 Greene St Unit PH
- 127 Spring St
- 127 Spring St Unit ID1035010P
- 91 Greene St
- 100 Wooster St
- 100 Wooster St Unit PH-
- 100 Wooster St Unit 2
- 100 Wooster St Unit 1
- 100 Wooster St Unit COM
- 100 Wooster St Unit 3
- 100 Wooster St Unit 5
- 139 Spring St Unit 7B
- 139 Spring St Unit 7A