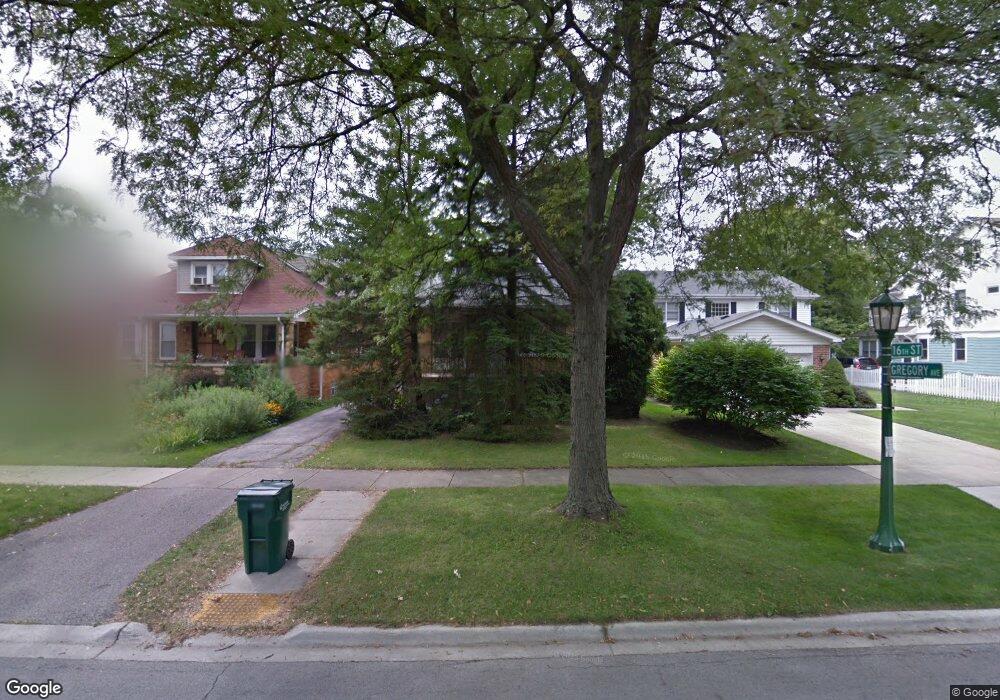
131 16th St Wilmette, IL 60091
Estimated Value: $697,786 - $847,000
3
Beds
1
Bath
1,104
Sq Ft
$702/Sq Ft
Est. Value
About This Home
This home is located at 131 16th St, Wilmette, IL 60091 and is currently estimated at $774,947, approximately $701 per square foot. 131 16th St is a home located in Cook County with nearby schools including McKenzie Elementary School, Highcrest Middle School, and Wilmette Junior High School.
Ownership History
Date
Name
Owned For
Owner Type
Purchase Details
Closed on
Feb 19, 1999
Sold by
Lanning Lisabeth Weiner
Bought by
Lanning Thomas R
Current Estimated Value
Home Financials for this Owner
Home Financials are based on the most recent Mortgage that was taken out on this home.
Original Mortgage
$162,164
Outstanding Balance
$36,426
Interest Rate
6.92%
Estimated Equity
$738,521
Purchase Details
Closed on
Aug 1, 1996
Sold by
Wilson Anne F
Bought by
Weiner Lanning Thomas R and Weiner Lanning Lisabeth
Home Financials for this Owner
Home Financials are based on the most recent Mortgage that was taken out on this home.
Original Mortgage
$190,000
Interest Rate
8.33%
Purchase Details
Closed on
Apr 15, 1994
Sold by
Wilson David B and Wilson Anne F
Bought by
Wilson Anne F
Create a Home Valuation Report for This Property
The Home Valuation Report is an in-depth analysis detailing your home's value as well as a comparison with similar homes in the area
Home Values in the Area
Average Home Value in this Area
Purchase History
| Date | Buyer | Sale Price | Title Company |
|---|---|---|---|
| Lanning Thomas R | -- | -- | |
| Weiner Lanning Thomas R | $280,000 | -- | |
| Wilson Anne F | -- | -- |
Source: Public Records
Mortgage History
| Date | Status | Borrower | Loan Amount |
|---|---|---|---|
| Open | Lanning Thomas R | $162,164 | |
| Closed | Weiner Lanning Thomas R | $190,000 |
Source: Public Records
Tax History
| Year | Tax Paid | Tax Assessment Tax Assessment Total Assessment is a certain percentage of the fair market value that is determined by local assessors to be the total taxable value of land and additions on the property. | Land | Improvement |
|---|---|---|---|---|
| 2025 | $5,767 | $62,001 | $17,323 | $44,678 |
| 2024 | $5,767 | $51,001 | $14,658 | $36,343 |
| 2023 | $5,632 | $51,001 | $14,658 | $36,343 |
| 2022 | $5,632 | $51,001 | $14,658 | $36,343 |
| 2021 | $6,633 | $40,148 | $10,660 | $29,488 |
| 2020 | $6,078 | $40,148 | $10,660 | $29,488 |
| 2019 | $5,997 | $43,640 | $10,660 | $32,980 |
| 2018 | $6,266 | $33,769 | $9,061 | $24,708 |
| 2017 | $5,986 | $33,769 | $9,061 | $24,708 |
| 2016 | $6,410 | $33,769 | $9,061 | $24,708 |
| 2015 | $6,456 | $30,502 | $7,462 | $23,040 |
| 2014 | $6,376 | $30,502 | $7,462 | $23,040 |
| 2013 | $6,503 | $30,502 | $7,462 | $23,040 |
Source: Public Records
Map
Nearby Homes
- 1521 Gregory Ave
- 125 15th St
- 2732 Lincolnwood Dr
- 1531 Wilmette Ave
- 2716 Ewing Ave
- 2731 Park Place
- 235 Ridge Rd Unit 4J
- 1241 Maple Ave
- 111 Park Ave
- 1209 Maple Ave
- 509 1/2 Ridge Rd
- 2508 Isabella St
- 411 Pine Manor Dr
- 2726 Central St Unit 3A
- 2726 Central St Unit 2D
- 2500 Thayer St
- 2717 Harrison St
- 3233 Central St
- 1917 Washington Ave
- 601 Ridge Rd Unit 202
- 127 16th St
- 135 16th St
- 125 16th St
- 205 16th St
- 205 16th St
- 121 16th St
- 132 Central Park Ave
- 134 Central Park Ave
- 207 16th St
- 126 Central Park Ave
- 200 Central Park Ave
- 200 Central Park Ave
- 122 Central Park Ave
- 117 16th St
- 206 Central Park Ave
- 206 Central Park Ave
- 211 16th St
- 128 16th St
- 120 Central Park Ave
- 200 16th St
Your Personal Tour Guide
Ask me questions while you tour the home.