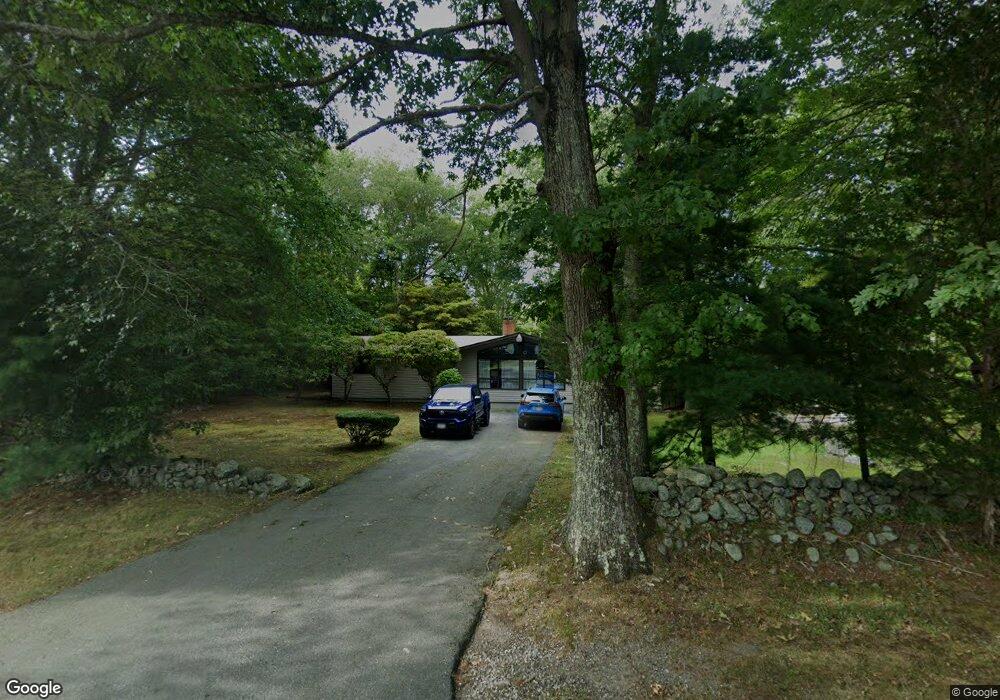
131 Baker Rd Swansea, MA 02777
Northeast Swansea NeighborhoodEstimated Value: $497,250 - $610,000
2
Beds
2
Baths
1,196
Sq Ft
$466/Sq Ft
Est. Value
About This Home
This home is located at 131 Baker Rd, Swansea, MA 02777 and is currently estimated at $557,313, approximately $465 per square foot. 131 Baker Rd is a home located in Bristol County with nearby schools including Joseph Case High School, SCEC Life Academy, and Swansea Wood School.
Ownership History
Date
Name
Owned For
Owner Type
Purchase Details
Closed on
Apr 14, 2010
Sold by
Martel Brian and Martel Sarah J
Bought by
Eckard Richard B and Eckard Darlene A
Current Estimated Value
Home Financials for this Owner
Home Financials are based on the most recent Mortgage that was taken out on this home.
Original Mortgage
$240,562
Outstanding Balance
$164,140
Interest Rate
5.5%
Mortgage Type
FHA
Estimated Equity
$393,173
Purchase Details
Closed on
Aug 14, 2007
Sold by
Martel Sarah J
Bought by
Martel Brian and Martel Sarah J
Home Financials for this Owner
Home Financials are based on the most recent Mortgage that was taken out on this home.
Original Mortgage
$105,000
Interest Rate
6.24%
Mortgage Type
Purchase Money Mortgage
Purchase Details
Closed on
Jun 29, 2007
Sold by
Hill Elwin A and Hill Irene
Bought by
Martel Sarah J
Home Financials for this Owner
Home Financials are based on the most recent Mortgage that was taken out on this home.
Original Mortgage
$105,000
Interest Rate
6.24%
Mortgage Type
Purchase Money Mortgage
Create a Home Valuation Report for This Property
The Home Valuation Report is an in-depth analysis detailing your home's value as well as a comparison with similar homes in the area
Home Values in the Area
Average Home Value in this Area
Purchase History
| Date | Buyer | Sale Price | Title Company |
|---|---|---|---|
| Eckard Richard B | $245,000 | -- | |
| Martel Brian | -- | -- | |
| Martel Sarah J | $293,150 | -- |
Source: Public Records
Mortgage History
| Date | Status | Borrower | Loan Amount |
|---|---|---|---|
| Open | Eckard Richard B | $240,562 | |
| Previous Owner | Martel Sarah J | $105,000 |
Source: Public Records
Tax History Compared to Growth
Tax History
| Year | Tax Paid | Tax Assessment Tax Assessment Total Assessment is a certain percentage of the fair market value that is determined by local assessors to be the total taxable value of land and additions on the property. | Land | Improvement |
|---|---|---|---|---|
| 2025 | $5,054 | $424,000 | $187,000 | $237,000 |
| 2024 | $5,012 | $418,000 | $187,000 | $231,000 |
| 2023 | $4,768 | $363,100 | $139,700 | $223,400 |
| 2022 | $4,730 | $328,700 | $128,000 | $200,700 |
| 2021 | $4,403 | $281,700 | $128,000 | $153,700 |
| 2020 | $4,140 | $265,700 | $128,000 | $137,700 |
| 2019 | $3,926 | $253,100 | $115,400 | $137,700 |
| 2018 | $3,770 | $246,700 | $113,700 | $133,000 |
| 2017 | $3,276 | $246,700 | $113,700 | $133,000 |
| 2016 | $3,143 | $232,500 | $99,400 | $133,100 |
| 2015 | $2,877 | $219,100 | $99,400 | $119,700 |
| 2014 | $2,834 | $220,700 | $99,400 | $121,300 |
Source: Public Records
Map
Nearby Homes
- 48 Laurie Ln
- 2660 Courtlyn Rd
- 35 Clubhouse Dr Unit RR35
- RR33 Club House Dr Unit Lot RR33
- 3064 Clubhouse Dr
- 3094 Millers Ln
- 3035 Clubhouse Dr Unit 6
- 3035 Clubhouse Dr Unit 8
- 3049 Clubhouse Dr Unit 77
- 3035 Clubhouse Dr Unit 2
- 3055 Clubhouse Dr Unit 80
- 3035 Clubhouse Dr
- 3035 Clubhouse Dr Unit 4
- 3035 Clubhouse Dr Unit 1
- 3051 Clubhouse Dr Unit 78
- 3035 Clubhouse Dr Unit 3
- 3035 Clubhouse Dr Unit 7
- 3035 Clubhouse Dr Unit 5
- 3045 Clubhouse Dr Unit Lot 75
- 3057 Clubhouse Dr