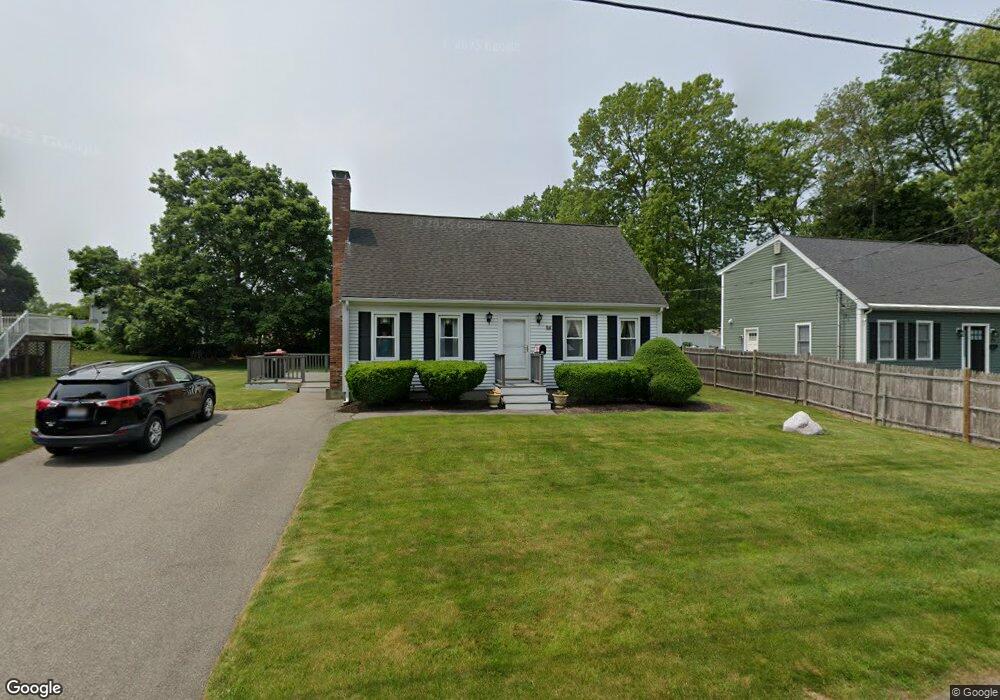
131 Cambo St Brockton, MA 02301
Clifton Heights NeighborhoodEstimated Value: $488,000 - $549,000
3
Beds
2
Baths
1,428
Sq Ft
$366/Sq Ft
Est. Value
About This Home
This home is located at 131 Cambo St, Brockton, MA 02301 and is currently estimated at $523,314, approximately $366 per square foot. 131 Cambo St is a home located in Plymouth County with nearby schools including Gilmore Elementary School, John F. Kennedy Elementary School, and Davis K-8 School.
Ownership History
Date
Name
Owned For
Owner Type
Purchase Details
Closed on
Feb 3, 2025
Sold by
Jones Thomas F and Jones Carole T
Bought by
Jones Ft and Robinson
Current Estimated Value
Purchase Details
Closed on
Apr 21, 2004
Sold by
Cambo Rt and Jones Thomas Francis
Bought by
Jones Thomas F and Jones Carole T
Purchase Details
Closed on
Dec 18, 1989
Sold by
Mccann Thomas J
Bought by
Jones Thomas F
Home Financials for this Owner
Home Financials are based on the most recent Mortgage that was taken out on this home.
Original Mortgage
$80,000
Interest Rate
9.73%
Mortgage Type
Purchase Money Mortgage
Create a Home Valuation Report for This Property
The Home Valuation Report is an in-depth analysis detailing your home's value as well as a comparison with similar homes in the area
Home Values in the Area
Average Home Value in this Area
Purchase History
| Date | Buyer | Sale Price | Title Company |
|---|---|---|---|
| Jones Ft | -- | None Available | |
| Jones Thomas F | -- | -- | |
| Jones Thomas F | $137,500 | -- |
Source: Public Records
Mortgage History
| Date | Status | Borrower | Loan Amount |
|---|---|---|---|
| Previous Owner | Jones Thomas F | $80,000 |
Source: Public Records
Tax History Compared to Growth
Tax History
| Year | Tax Paid | Tax Assessment Tax Assessment Total Assessment is a certain percentage of the fair market value that is determined by local assessors to be the total taxable value of land and additions on the property. | Land | Improvement |
|---|---|---|---|---|
| 2025 | $5,457 | $450,600 | $144,600 | $306,000 |
| 2024 | $5,379 | $447,500 | $144,600 | $302,900 |
| 2023 | $5,261 | $405,300 | $109,400 | $295,900 |
| 2022 | $4,975 | $356,100 | $99,400 | $256,700 |
| 2021 | $4,705 | $324,500 | $93,400 | $231,100 |
| 2020 | $4,822 | $318,300 | $89,600 | $228,700 |
| 2019 | $4,618 | $297,200 | $83,600 | $213,600 |
| 2018 | $4,213 | $262,300 | $83,600 | $178,700 |
| 2017 | $3,801 | $236,100 | $83,600 | $152,500 |
| 2016 | $4,017 | $231,400 | $79,700 | $151,700 |
| 2015 | $3,893 | $214,500 | $79,700 | $134,800 |
| 2014 | $3,704 | $204,300 | $79,700 | $124,600 |
Source: Public Records
Map
Nearby Homes