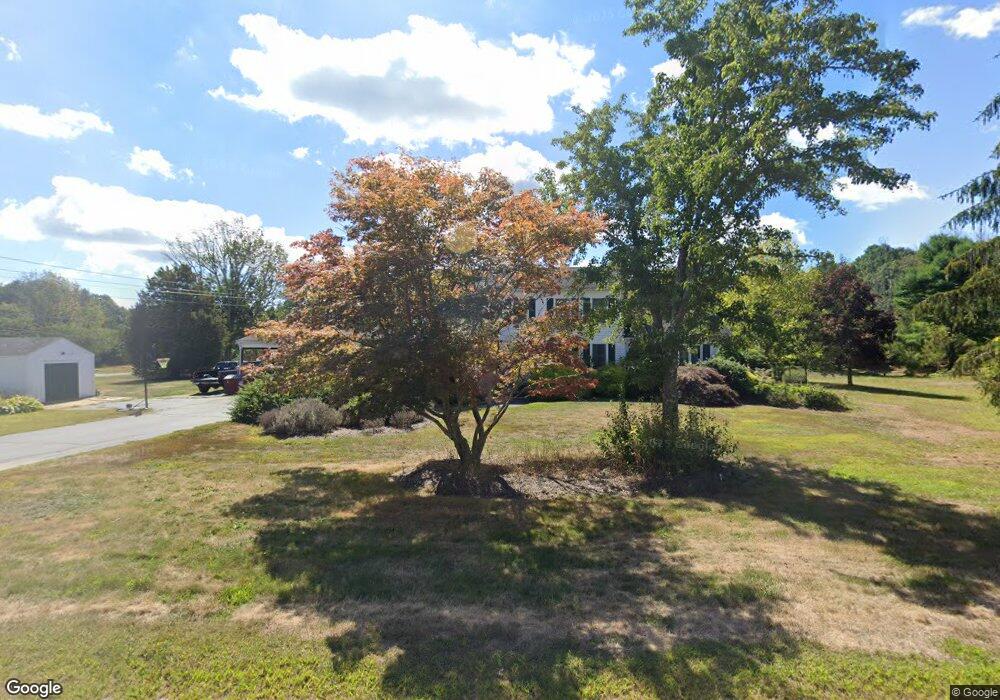
131 Chace Rd East Freetown, MA 02717
Estimated Value: $658,973 - $899,000
5
Beds
2
Baths
2,520
Sq Ft
$299/Sq Ft
Est. Value
About This Home
This home is located at 131 Chace Rd, East Freetown, MA 02717 and is currently estimated at $754,493, approximately $299 per square foot. 131 Chace Rd is a home located in Bristol County with nearby schools including Freetown Elementary School, George R Austin Intermediate School, and Freetown-Lakeville Middle School.
Ownership History
Date
Name
Owned For
Owner Type
Purchase Details
Closed on
Oct 3, 2022
Sold by
Gaynor Francis D
Bought by
Gaynor Sandra U and Gaynor Ann E
Current Estimated Value
Purchase Details
Closed on
Jan 29, 1998
Sold by
Stanley Norval A
Bought by
Gaynor Francis D
Purchase Details
Closed on
Apr 23, 1992
Sold by
Marcotte Rosalie L
Bought by
Stanley Norval A
Create a Home Valuation Report for This Property
The Home Valuation Report is an in-depth analysis detailing your home's value as well as a comparison with similar homes in the area
Home Values in the Area
Average Home Value in this Area
Purchase History
| Date | Buyer | Sale Price | Title Company |
|---|---|---|---|
| Gaynor Sandra U | -- | None Available | |
| Gaynor Francis D | $165,000 | -- | |
| Stanley Norval A | $145,000 | -- |
Source: Public Records
Mortgage History
| Date | Status | Borrower | Loan Amount |
|---|---|---|---|
| Previous Owner | Stanley Norval A | $231,500 | |
| Previous Owner | Stanley Norval A | $75,000 |
Source: Public Records
Tax History Compared to Growth
Tax History
| Year | Tax Paid | Tax Assessment Tax Assessment Total Assessment is a certain percentage of the fair market value that is determined by local assessors to be the total taxable value of land and additions on the property. | Land | Improvement |
|---|---|---|---|---|
| 2025 | $5,884 | $593,700 | $173,800 | $419,900 |
| 2024 | $5,846 | $560,500 | $164,000 | $396,500 |
| 2023 | $5,760 | $537,800 | $147,700 | $390,100 |
| 2022 | $5,486 | $454,900 | $125,100 | $329,800 |
| 2021 | $5,262 | $414,300 | $113,700 | $300,600 |
| 2020 | $5,290 | $406,300 | $109,400 | $296,900 |
| 2019 | $5,031 | $382,600 | $104,100 | $278,500 |
| 2018 | $4,706 | $353,600 | $104,100 | $249,500 |
| 2017 | $4,555 | $342,000 | $104,100 | $237,900 |
| 2016 | $4,341 | $331,600 | $101,200 | $230,400 |
| 2015 | $4,359 | $337,900 | $101,200 | $236,700 |
| 2014 | $4,213 | $334,100 | $99,100 | $235,000 |
Source: Public Records
Map
Nearby Homes
- 144 Chace Rd
- 0 Costa Dr
- 195 Slab Bridge Rd
- 24 Bells Brook Rd
- 599 Quanapoag Rd
- 150 Quanapoag Rd
- Lot 2/3 Quanapoag Rd
- 9 Paul Ave
- 1475 Braley Rd Unit 17
- 4597 Acushnet Ave
- 7 Great Cedar Crossing
- 13 Luscomb Ln
- 16 Swallow St
- 5 Freetown St
- 1069 Cherokee St
- 319 Northwest St
- 15 Morrison Way
- 34 Poplar Rd
- 20 Slab Bridge Rd
- 210 Heritage Dr