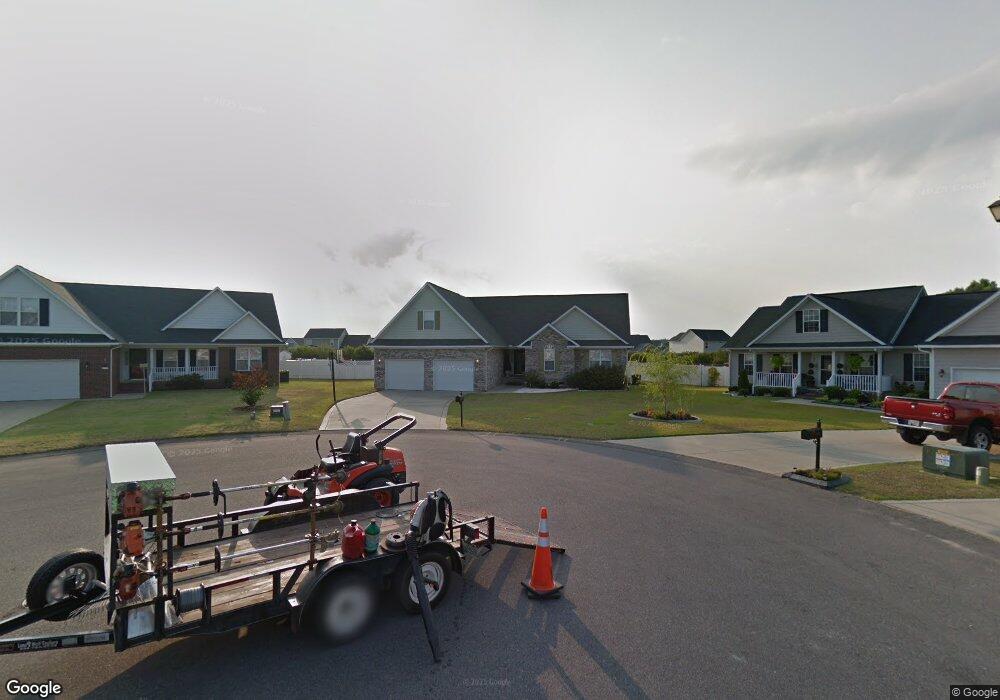
131 Dunbar Ct Raeford, NC 28376
Estimated Value: $318,636 - $323,000
Studio
3
Baths
2,107
Sq Ft
$152/Sq Ft
Est. Value
About This Home
This home is located at 131 Dunbar Ct, Raeford, NC 28376 and is currently estimated at $320,659, approximately $152 per square foot. 131 Dunbar Ct is a home located in Hoke County with nearby schools including Rockfish Hoke Elementary School, East Hoke Middle, and Hoke County High.
Ownership History
Date
Name
Owned For
Owner Type
Purchase Details
Closed on
Aug 14, 2017
Sold by
Black Jumai A
Bought by
Black Jumai A and Black Melissa
Current Estimated Value
Purchase Details
Closed on
Apr 9, 2007
Sold by
Heins Kevin D and Heins Jillian A
Bought by
Black Jumal A
Home Financials for this Owner
Home Financials are based on the most recent Mortgage that was taken out on this home.
Original Mortgage
$226,773
Outstanding Balance
$136,434
Interest Rate
6.15%
Mortgage Type
VA
Estimated Equity
$184,225
Purchase Details
Closed on
May 9, 2005
Sold by
H & H Constructors Inc
Bought by
Heins Kevin D and Heins Jillian A
Home Financials for this Owner
Home Financials are based on the most recent Mortgage that was taken out on this home.
Original Mortgage
$191,001
Interest Rate
5.8%
Mortgage Type
VA
Create a Home Valuation Report for This Property
The Home Valuation Report is an in-depth analysis detailing your home's value as well as a comparison with similar homes in the area
Home Values in the Area
Average Home Value in this Area
Purchase History
| Date | Buyer | Sale Price | Title Company |
|---|---|---|---|
| Black Jumai A | -- | None Available | |
| Black Jumal A | $222,000 | None Available | |
| Heins Kevin D | $185,000 | None Available |
Source: Public Records
Mortgage History
| Date | Status | Borrower | Loan Amount |
|---|---|---|---|
| Open | Black Jumal A | $226,773 | |
| Previous Owner | Heins Kevin D | $191,001 |
Source: Public Records
Tax History
| Year | Tax Paid | Tax Assessment Tax Assessment Total Assessment is a certain percentage of the fair market value that is determined by local assessors to be the total taxable value of land and additions on the property. | Land | Improvement |
|---|---|---|---|---|
| 2025 | $2,059 | $283,160 | $33,000 | $250,160 |
| 2024 | $2,059 | $283,160 | $33,000 | $250,160 |
| 2023 | $2,059 | $283,160 | $33,000 | $250,160 |
| 2022 | $2,021 | $283,160 | $33,000 | $250,160 |
| 2021 | $1,615 | $227,600 | $21,000 | $206,600 |
| 2020 | $1,644 | $227,600 | $21,000 | $206,600 |
| 2019 | $1,644 | $227,600 | $21,000 | $206,600 |
| 2018 | $2,017 | $227,600 | $21,000 | $206,600 |
| 2017 | $2,017 | $227,600 | $21,000 | $206,600 |
| 2016 | $1,979 | $227,600 | $21,000 | $206,600 |
| 2015 | $1,979 | $227,600 | $21,000 | $206,600 |
| 2014 | $1,954 | $227,600 | $21,000 | $206,600 |
| 2013 | -- | $205,870 | $23,000 | $182,870 |
Source: Public Records
Map
Nearby Homes
- 168 Bennington Dr
- 1486 Saint Johns Loop
- 151 Huntington Dr
- 172 Collinwood Dr
- 273 Saint George Dr
- 196 Lochwood Dr
- 208 Lochwood Dr
- 151 Ivy Stone Dr
- 202 Ivy Stone Dr
- 626 Fairfield Cir
- 521 Fairfield Cir
- 169 Eclipse Ct
- 188 Stockbridge Dr
- 131 Emerywood Ct
- 219 Stockbridge Dr
- 258 Lennox Loop
- 505 Collinwood Dr
- 667 Saint Johns Loop
- 601 Collinwood Dr
- 573 Thorncliff Dr
- 119 Dunbar Ct
- 143 Dunbar Ct
- 138 Dunbar Ct
- 151 Thorncliff Dr
- 159 Thorncliff Dr
- 116 Dunbar Ct
- 115 Thorncliff Dr
- 124 Dunbar Ct
- 1047 Fairfield Cir
- 1035 Fairfield Cir
- 1059 Fairfield Cir
- 168 Thorncliff Dr
- 1073 Fairfield Cir
- 1035 Fairfield (L93) Cir
- 1083 Fairfield Cir
- 1407 Fairfield Cir
- 140 Thorncliff Dr
- 1023 Fairfield Cir
- 188 Thorncliff Dr
- 1097 Fairfield Cir
Your Personal Tour Guide
Ask me questions while you tour the home.