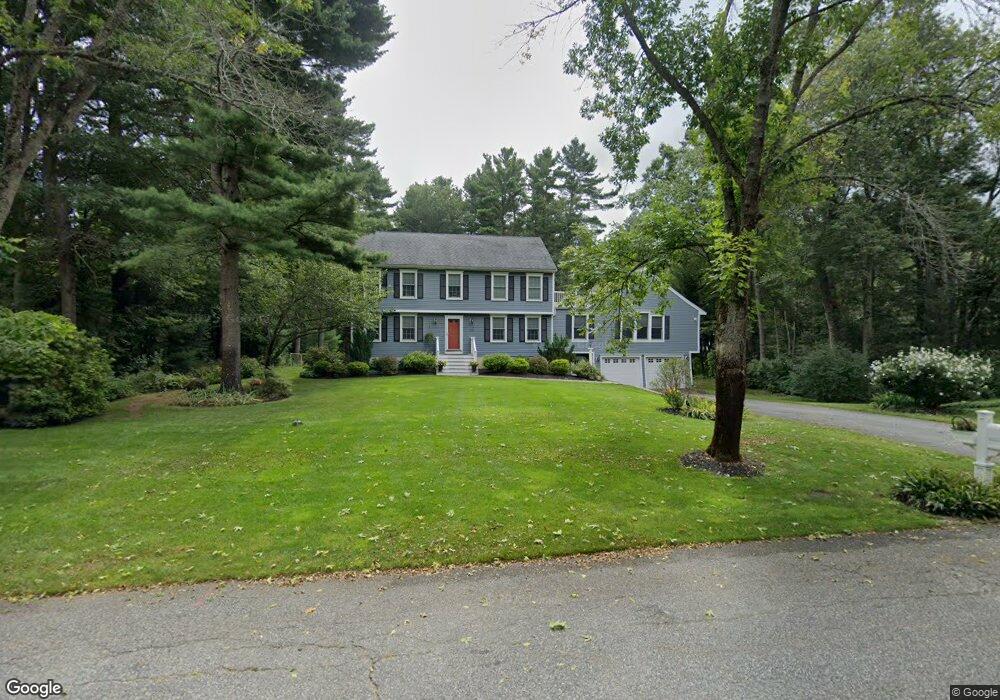
131 Duncan Dr North Andover, MA 01845
Estimated Value: $1,005,477 - $1,121,000
5
Beds
3
Baths
3,039
Sq Ft
$343/Sq Ft
Est. Value
About This Home
This home is located at 131 Duncan Dr, North Andover, MA 01845 and is currently estimated at $1,042,369, approximately $342 per square foot. 131 Duncan Dr is a home located in Essex County with nearby schools including Annie L Sargent Elementary School, North Andover Middle School, and North Andover High School.
Ownership History
Date
Name
Owned For
Owner Type
Purchase Details
Closed on
Sep 18, 2000
Sold by
Murphy James F and Hoffmann Nancy A
Bought by
Burns Daniel C and Burns Linda R
Current Estimated Value
Home Financials for this Owner
Home Financials are based on the most recent Mortgage that was taken out on this home.
Original Mortgage
$320,000
Interest Rate
8.07%
Mortgage Type
Purchase Money Mortgage
Purchase Details
Closed on
May 4, 1988
Sold by
Swartz Beth A
Bought by
Hoffman Nancy A
Create a Home Valuation Report for This Property
The Home Valuation Report is an in-depth analysis detailing your home's value as well as a comparison with similar homes in the area
Home Values in the Area
Average Home Value in this Area
Purchase History
| Date | Buyer | Sale Price | Title Company |
|---|---|---|---|
| Burns Daniel C | $400,000 | -- | |
| Hoffman Nancy A | $280,000 | -- |
Source: Public Records
Mortgage History
| Date | Status | Borrower | Loan Amount |
|---|---|---|---|
| Open | Hoffman Nancy A | $411,000 | |
| Closed | Hoffman Nancy A | $318,000 | |
| Closed | Hoffman Nancy A | $320,000 |
Source: Public Records
Tax History Compared to Growth
Tax History
| Year | Tax Paid | Tax Assessment Tax Assessment Total Assessment is a certain percentage of the fair market value that is determined by local assessors to be the total taxable value of land and additions on the property. | Land | Improvement |
|---|---|---|---|---|
| 2025 | $10,184 | $904,400 | $415,400 | $489,000 |
| 2024 | $9,686 | $873,400 | $393,600 | $479,800 |
| 2023 | $9,228 | $753,900 | $332,400 | $421,500 |
| 2022 | $8,953 | $661,700 | $301,900 | $359,800 |
| 2021 | $8,573 | $605,000 | $273,600 | $331,400 |
| 2020 | $8,313 | $605,000 | $273,600 | $331,400 |
| 2019 | $8,113 | $605,000 | $273,600 | $331,400 |
| 2018 | $8,791 | $605,000 | $273,600 | $331,400 |
| 2017 | $7,684 | $538,100 | $214,400 | $323,700 |
| 2016 | $7,265 | $509,100 | $213,100 | $296,000 |
| 2015 | $6,814 | $473,500 | $209,600 | $263,900 |
Source: Public Records
Map
Nearby Homes
- 114 Stonecleave Rd
- Lot 10 Stonecleave Rd
- 590 Foster St
- 53 Lawrence Rd
- Lot 2 (31) Lawrence Rd
- 50 Stonecleave Rd
- 55 Sheffield Rd
- 121 Cortland Dr
- 39 Sheffield Rd
- 141 Cortland Dr Unit 141
- 141 Cortland Dr
- 851 Forest St
- 10 High Ridge Rd
- 10 Woodchuck Ln
- 427b Ipswich Rd
- 660 Sharpners Pond Rd
- 24 Appleton Ln
- 534 Ipswich Rd
- 45 Thistle Rd
- 75 Thistle Rd