131 E Chandler St Carrollton, GA 30117
Estimated Value: $201,000 - $245,000
2
Beds
2
Baths
1,490
Sq Ft
$148/Sq Ft
Est. Value
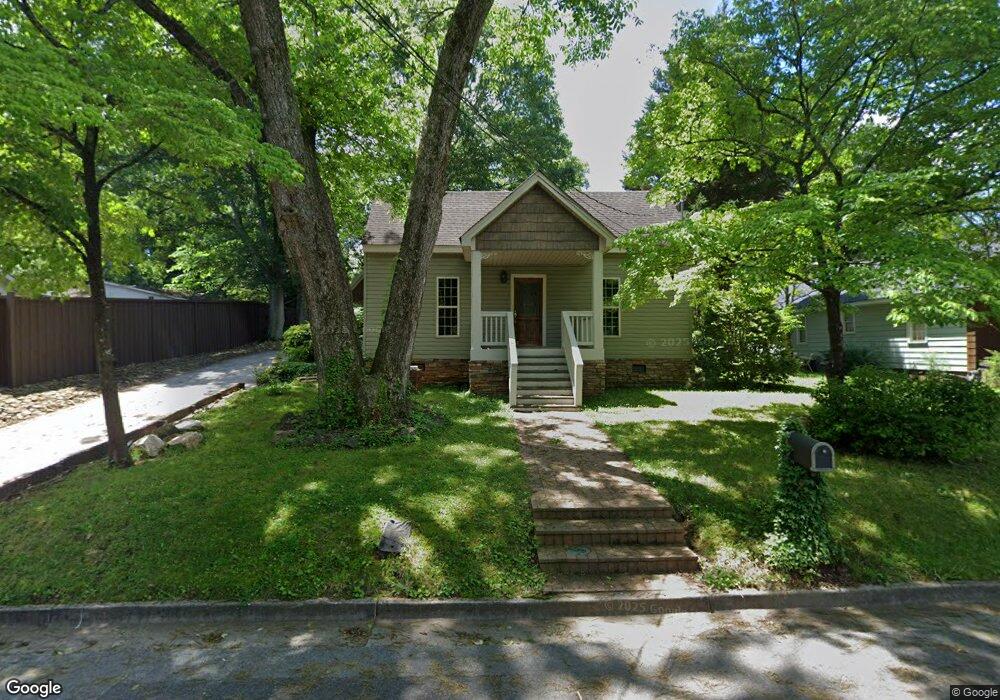
About This Home
This home is located at 131 E Chandler St, Carrollton, GA 30117 and is currently estimated at $220,718, approximately $148 per square foot. 131 E Chandler St is a home located in Carroll County with nearby schools including Carrollton Elementary School, Carrollton Upper Elementary School, and Carrollton Middle School.
Ownership History
Date
Name
Owned For
Owner Type
Purchase Details
Closed on
Oct 17, 2014
Sold by
Vance Mary Farrenkopf
Bought by
Farrenkopf Steven S
Current Estimated Value
Purchase Details
Closed on
Mar 14, 2011
Sold by
Hicks Mary
Bought by
Farrenkopf Steven S
Purchase Details
Closed on
Oct 9, 2009
Sold by
Farrenkopf Steven
Bought by
Hicks Mary
Purchase Details
Closed on
Aug 28, 2008
Sold by
Federal Home Loan Mortgage Corporation
Bought by
Farrenkopf Steven S
Purchase Details
Closed on
Jul 1, 2008
Sold by
Not Provided
Bought by
Hicks Mary
Purchase Details
Closed on
Oct 7, 1999
Sold by
Rivera Roberto
Bought by
Bueno Norman
Purchase Details
Closed on
Oct 25, 1986
Bought by
Rivera Rivera R and Rivera Harman C
Create a Home Valuation Report for This Property
The Home Valuation Report is an in-depth analysis detailing your home's value as well as a comparison with similar homes in the area
Home Values in the Area
Average Home Value in this Area
Purchase History
| Date | Buyer | Sale Price | Title Company |
|---|---|---|---|
| Farrenkopf Steven S | -- | -- | |
| Farrenkopf Steven S | -- | -- | |
| Farrenkopf Steven S | -- | -- | |
| Hicks Mary | -- | -- | |
| Farrenkopf Steven S | -- | -- | |
| Hicks Mary | $71,418 | -- | |
| Hicks Mary | $71,418 | -- | |
| Bueno Norman | $54,000 | -- | |
| Rivera Roberto | -- | -- | |
| Rivera Rivera R | -- | -- |
Source: Public Records
Tax History Compared to Growth
Tax History
| Year | Tax Paid | Tax Assessment Tax Assessment Total Assessment is a certain percentage of the fair market value that is determined by local assessors to be the total taxable value of land and additions on the property. | Land | Improvement |
|---|---|---|---|---|
| 2024 | $1,490 | $65,148 | $24,000 | $41,148 |
| 2023 | $1,490 | $61,450 | $24,000 | $37,450 |
| 2022 | $1,137 | $46,012 | $15,990 | $30,022 |
| 2021 | $945 | $37,676 | $11,850 | $25,826 |
| 2020 | $891 | $35,260 | $11,850 | $23,410 |
| 2019 | $859 | $33,549 | $11,850 | $21,699 |
| 2018 | $826 | $31,591 | $11,850 | $19,741 |
| 2017 | $830 | $31,591 | $11,850 | $19,741 |
| 2016 | $1,000 | $38,871 | $14,336 | $24,535 |
| 2015 | $637 | $20,640 | $5,152 | $15,488 |
| 2014 | $640 | $20,640 | $5,152 | $15,488 |
Source: Public Records
Map
Nearby Homes
- 103 W Chandler St
- 777 College St
- 541 N White St Unit 12
- 541 N White St
- 110 Town Walk Ln
- 0 Ward St Unit 10390499
- 108 Springwood Dr
- 205 Johnson Ave Unit 231
- 405 N Park St
- TRACT1-7 Us Highway 27
- 201 Stewart St
- 322 Cedar St
- 120 Stewart St
- 123 Cedar Park Way
- 654 King St
- 119 Oxford Square
- 301 C4 Bradley St
- 109 S Park St
- 123 Autumn Glen Dr
- 301 Bradley St
- 127 E Chandler St
- 532 College St
- 526 College St
- 522 College St
- 130 E Chandler St
- 602 College St
- 115 E Chandler St
- 126 E Chandler St
- 122 E Chandler St
- 231 Oak Ave
- E E Chandler St
- 606 College St
- 114 E Chandler St
- 527 College St
- 109 E Chandler St
- 523 College St
- 535 College St
- 519 College St
- 601 College St Unit 603
- 110 E Chandler St