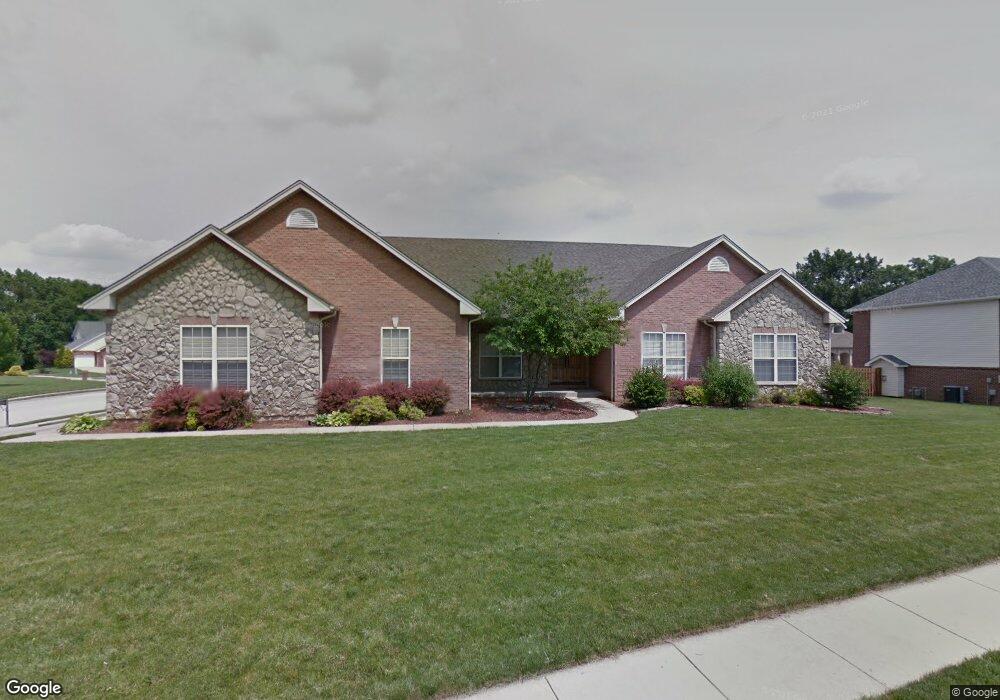
131 Eden Park Blvd O Fallon, IL 62269
Estimated Value: $383,000 - $440,000
3
Beds
2
Baths
2,140
Sq Ft
$194/Sq Ft
Est. Value
About This Home
This home is located at 131 Eden Park Blvd, O Fallon, IL 62269 and is currently estimated at $415,433, approximately $194 per square foot. 131 Eden Park Blvd is a home located in St. Clair County with nearby schools including Shiloh Elementary School, Shiloh Middle School, and O'Fallon Township High School.
Ownership History
Date
Name
Owned For
Owner Type
Purchase Details
Closed on
Feb 5, 2009
Sold by
Townsend Danton M and Townsend Rachel V
Bought by
Barkhaus Scott K and Barkhaus Erika E
Current Estimated Value
Home Financials for this Owner
Home Financials are based on the most recent Mortgage that was taken out on this home.
Original Mortgage
$275,742
Outstanding Balance
$173,648
Interest Rate
5.03%
Mortgage Type
FHA
Estimated Equity
$241,785
Purchase Details
Closed on
Jun 20, 2002
Sold by
Pagano Development Inc
Bought by
Townsend Danton M and Townsend Rachel
Home Financials for this Owner
Home Financials are based on the most recent Mortgage that was taken out on this home.
Original Mortgage
$241,150
Interest Rate
6.87%
Mortgage Type
Purchase Money Mortgage
Create a Home Valuation Report for This Property
The Home Valuation Report is an in-depth analysis detailing your home's value as well as a comparison with similar homes in the area
Home Values in the Area
Average Home Value in this Area
Purchase History
| Date | Buyer | Sale Price | Title Company |
|---|---|---|---|
| Barkhaus Scott K | $281,000 | Pti | |
| Townsend Danton M | $254,000 | Benchmark Title Company |
Source: Public Records
Mortgage History
| Date | Status | Borrower | Loan Amount |
|---|---|---|---|
| Open | Barkhaus Scott K | $275,742 | |
| Previous Owner | Townsend Danton M | $241,150 |
Source: Public Records
Tax History Compared to Growth
Tax History
| Year | Tax Paid | Tax Assessment Tax Assessment Total Assessment is a certain percentage of the fair market value that is determined by local assessors to be the total taxable value of land and additions on the property. | Land | Improvement |
|---|---|---|---|---|
| 2024 | $7,872 | $112,181 | $20,621 | $91,560 |
| 2023 | $7,980 | $111,212 | $20,016 | $91,196 |
| 2022 | $7,631 | $103,588 | $18,644 | $84,944 |
| 2021 | $7,102 | $97,412 | $17,532 | $79,880 |
| 2020 | $7,317 | $91,937 | $16,546 | $75,391 |
| 2019 | $7,342 | $93,987 | $17,188 | $76,799 |
| 2018 | $7,201 | $91,303 | $16,697 | $74,606 |
| 2017 | $6,970 | $87,015 | $15,913 | $71,102 |
| 2016 | $6,914 | $85,359 | $15,610 | $69,749 |
| 2014 | $6,211 | $83,403 | $14,269 | $69,134 |
| 2013 | $6,065 | $84,527 | $14,461 | $70,066 |
Source: Public Records
Map
Nearby Homes
- 3830 Breezy Hill
- 3745 Thicket Dr
- 505 Master Ct
- 3719 Thicket Dr
- 3740 Golfview Cir
- 409 Sage Dr
- 3714 Thicket Dr
- 433 Briarberry Dr
- 3716 Osprey Ct
- 414 Grand Reserve
- 3700 Osprey Ct
- 3533 Capri Ln
- 101 Montrose Ct
- 3536 Harbor Way
- 3567 Sky Hawk Dr
- 869 Ashley Cove Ct
- 845 Mohave Ct
- 120 Cindy Ln Unit 102-120
- 3424 Navajo Trail
- xxxx Chippewa Dr
- 127 Eden Park Blvd
- 4208 Pommel Point
- 4203 Pommel Point
- 124 Eden Park Blvd
- 121 Eden Park Blvd
- 200 Eden Park Blvd
- 120 Eden Park Blvd
- 4207 Pommel Point
- 204 Eden Park Blvd
- 4212 Pommel Point
- 117 Eden Park Blvd
- 207 Eden Park Blvd
- 113 Eden Park Blvd
- 208 Eden Park Blvd
- 116 Eden Park Blvd
- 212 Eden Park Blvd
- 211 Eden Park Blvd
- 109 Eden Park Blvd
- 112 Eden Park Blvd
- 4205 Silchar Club Ct