Estimated Value: $304,820 - $367,000
3
Beds
3
Baths
2,115
Sq Ft
$160/Sq Ft
Est. Value
About This Home
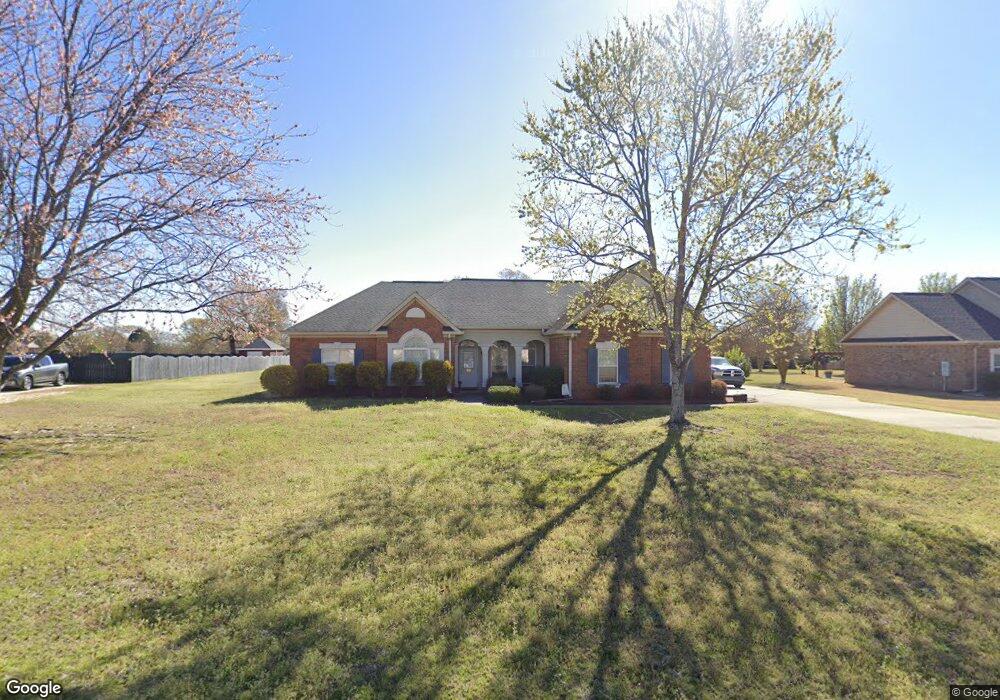
This home is located at 131 Elsa Way, Byron, GA 31008 and is currently estimated at $337,455, approximately $159 per square foot. 131 Elsa Way is a home located in Peach County with nearby schools including Kay Road Elementary School, Fort Valley Middle School, and Peach County High School.
Ownership History
Date
Name
Owned For
Owner Type
Purchase Details
Closed on
May 17, 2012
Sold by
Miller Bryan R
Bought by
Miller Bryan R and Miller Mary Ann M
Current Estimated Value
Purchase Details
Closed on
Jul 28, 2005
Sold by
Holcomb & Sons Constructai
Bought by
Miller Bryan R
Home Financials for this Owner
Home Financials are based on the most recent Mortgage that was taken out on this home.
Original Mortgage
$155,900
Interest Rate
5.48%
Mortgage Type
New Conventional
Purchase Details
Closed on
Nov 18, 2004
Sold by
H & H Land Development Corp
Bought by
Holcomb & Sons Construction Llc
Purchase Details
Closed on
Jun 15, 2004
Bought by
H & H Land Development Corp
Create a Home Valuation Report for This Property
The Home Valuation Report is an in-depth analysis detailing your home's value as well as a comparison with similar homes in the area
Home Values in the Area
Average Home Value in this Area
Purchase History
| Date | Buyer | Sale Price | Title Company |
|---|---|---|---|
| Miller Bryan R | -- | -- | |
| Miller Bryan R | $194,900 | -- | |
| Holcomb & Sons Construction Llc | $32,900 | -- | |
| H & H Land Development Corp | -- | -- |
Source: Public Records
Mortgage History
| Date | Status | Borrower | Loan Amount |
|---|---|---|---|
| Previous Owner | Miller Bryan R | $155,900 |
Source: Public Records
Tax History
| Year | Tax Paid | Tax Assessment Tax Assessment Total Assessment is a certain percentage of the fair market value that is determined by local assessors to be the total taxable value of land and additions on the property. | Land | Improvement |
|---|---|---|---|---|
| 2025 | $2,914 | $110,120 | $9,280 | $100,840 |
| 2024 | $2,999 | $106,720 | $9,600 | $97,120 |
| 2023 | $2,952 | $104,080 | $9,600 | $94,480 |
| 2022 | $2,627 | $92,000 | $9,600 | $82,400 |
| 2021 | $2,598 | $78,680 | $9,600 | $69,080 |
| 2020 | $2,688 | $81,560 | $9,600 | $71,960 |
| 2019 | $2,635 | $79,480 | $9,600 | $69,880 |
| 2018 | $2,647 | $79,480 | $9,600 | $69,880 |
| 2017 | $2,659 | $79,480 | $9,600 | $69,880 |
| 2016 | $2,649 | $79,480 | $9,600 | $69,880 |
| 2015 | $2,653 | $79,480 | $9,600 | $69,880 |
| 2014 | $2,657 | $79,480 | $9,600 | $69,880 |
| 2013 | -- | $79,480 | $9,600 | $69,880 |
Source: Public Records
Map
Nearby Homes
- 264 Lillian Dr
- 116 Early Dr
- 161 Rowland Cir
- 119 Early Dr
- 800 John E Sullivan Rd
- 109 Red Tail Cir
- 19C Crown Ct
- 171 Hawks Ridge Trace
- 0 Barker Rd Unit 243030
- 0 Barker Rd Unit 14258525
- 0 Barker Rd Unit 175053
- 3379 Housers Mill Rd
- 204 Brandon Way
- 0 Housers Mill Rd Unit 5515996
- 450 Jones Rd
- 251 Hampton Oaks Way
- 4682 Housers Mill Rd
- 173 Preston Rd
- Lot 6 Trojan Way
- Lot 2 Trojan Way
Your Personal Tour Guide
Ask me questions while you tour the home.