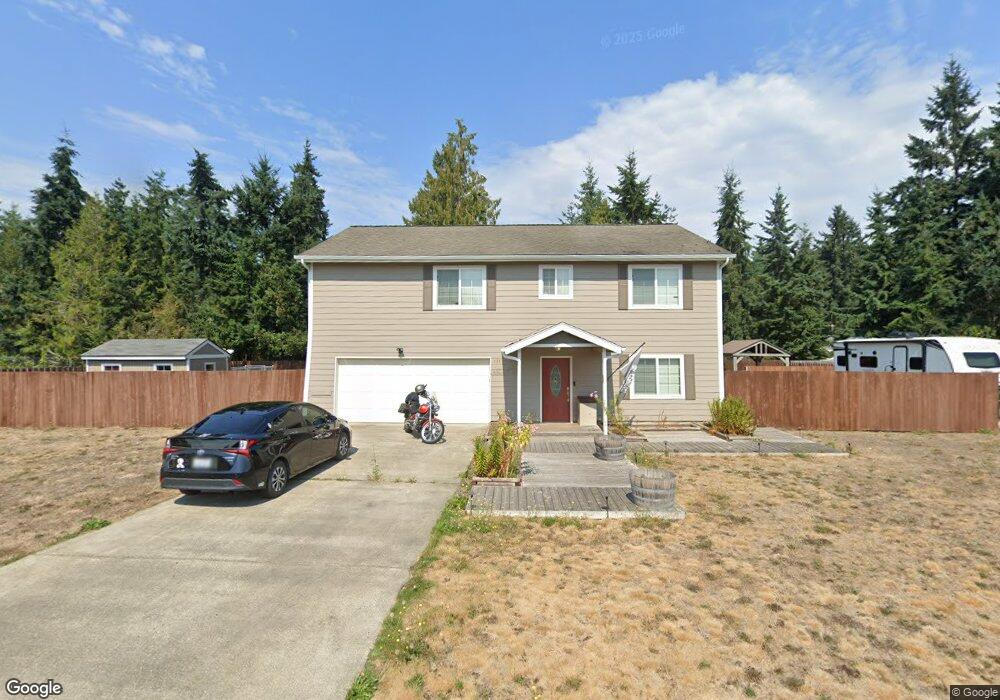
131 Frayne St Port Hadlock, WA 98339
Port Hadlock-Irondale NeighborhoodEstimated Value: $494,000 - $570,000
3
Beds
3
Baths
2,048
Sq Ft
$258/Sq Ft
Est. Value
About This Home
This home is located at 131 Frayne St, Port Hadlock, WA 98339 and is currently estimated at $528,013, approximately $257 per square foot. 131 Frayne St is a home located in Jefferson County with nearby schools including Chimacum Creek Primary School, Chimacum School Pi Program, and Chimacum Elementary School.
Ownership History
Date
Name
Owned For
Owner Type
Purchase Details
Closed on
Oct 23, 2023
Sold by
Correa N Quincy N and Correa Pamela K
Bought by
Turner Jake
Current Estimated Value
Home Financials for this Owner
Home Financials are based on the most recent Mortgage that was taken out on this home.
Original Mortgage
$230,743
Outstanding Balance
$226,047
Interest Rate
7.18%
Mortgage Type
FHA
Estimated Equity
$301,966
Purchase Details
Closed on
May 22, 2007
Sold by
Conrad Denny M and Conrad Erin N
Bought by
Correa N Quincy and Correa Pamela K
Home Financials for this Owner
Home Financials are based on the most recent Mortgage that was taken out on this home.
Original Mortgage
$280,000
Interest Rate
6.18%
Mortgage Type
New Conventional
Purchase Details
Closed on
May 23, 2006
Sold by
Conrad Denny
Bought by
Conrad Denny M and Conrad Erin N
Home Financials for this Owner
Home Financials are based on the most recent Mortgage that was taken out on this home.
Original Mortgage
$68,000
Interest Rate
6.56%
Mortgage Type
Credit Line Revolving
Create a Home Valuation Report for This Property
The Home Valuation Report is an in-depth analysis detailing your home's value as well as a comparison with similar homes in the area
Home Values in the Area
Average Home Value in this Area
Purchase History
| Date | Buyer | Sale Price | Title Company |
|---|---|---|---|
| Turner Jake | $106,620 | First American Title | |
| Correa N Quincy | $295,000 | First American Title Co | |
| Conrad Denny M | -- | None Available |
Source: Public Records
Mortgage History
| Date | Status | Borrower | Loan Amount |
|---|---|---|---|
| Open | Turner Jake | $230,743 | |
| Previous Owner | Correa N Quincy | $280,000 | |
| Previous Owner | Conrad Denny M | $68,000 |
Source: Public Records
Tax History Compared to Growth
Tax History
| Year | Tax Paid | Tax Assessment Tax Assessment Total Assessment is a certain percentage of the fair market value that is determined by local assessors to be the total taxable value of land and additions on the property. | Land | Improvement |
|---|---|---|---|---|
| 2024 | $3,364 | $446,386 | $94,500 | $351,886 |
| 2023 | $3,364 | $420,891 | $85,000 | $335,891 |
| 2022 | $2,648 | $363,380 | $70,000 | $293,380 |
| 2021 | $2,724 | $293,341 | $60,500 | $232,841 |
| 2020 | $2,596 | $284,028 | $60,500 | $223,528 |
| 2019 | $2,461 | $262,650 | $57,750 | $204,900 |
| 2018 | $2,694 | $250,587 | $55,000 | $195,587 |
| 2017 | $2,013 | $241,273 | $55,000 | $186,273 |
| 2016 | $2,011 | $191,353 | $50,000 | $141,353 |
| 2015 | $1,981 | $191,353 | $50,000 | $141,353 |
| 2014 | -- | $191,353 | $50,000 | $141,353 |
| 2013 | -- | $191,355 | $50,000 | $141,355 |
Source: Public Records
Map
Nearby Homes
- 31 Petes Spur
- 51 Thomas Dr
- 31 2nd St
- 0 E Eugene St
- 611 Cedar Ave Unit 51
- 611 Cedar Ave Unit 33
- 611 Cedar Ave Unit 62
- 781 Irondale Rd
- 13 Loretta Ln
- 52 E Moore St
- 12 Loretta Ln
- 371 E Price St
- 1210 Irondale Rd
- 0 NKA C St
- 10955 NKA Rhody Dr
- 0 901024068 Unit NWM2387187
- 0 901024068 Unit Port Hadlock WA 9833
- 153 Sunset Meadows Ln
- 177 Sunset Meadows Ln
- 0 N Andrew Ave