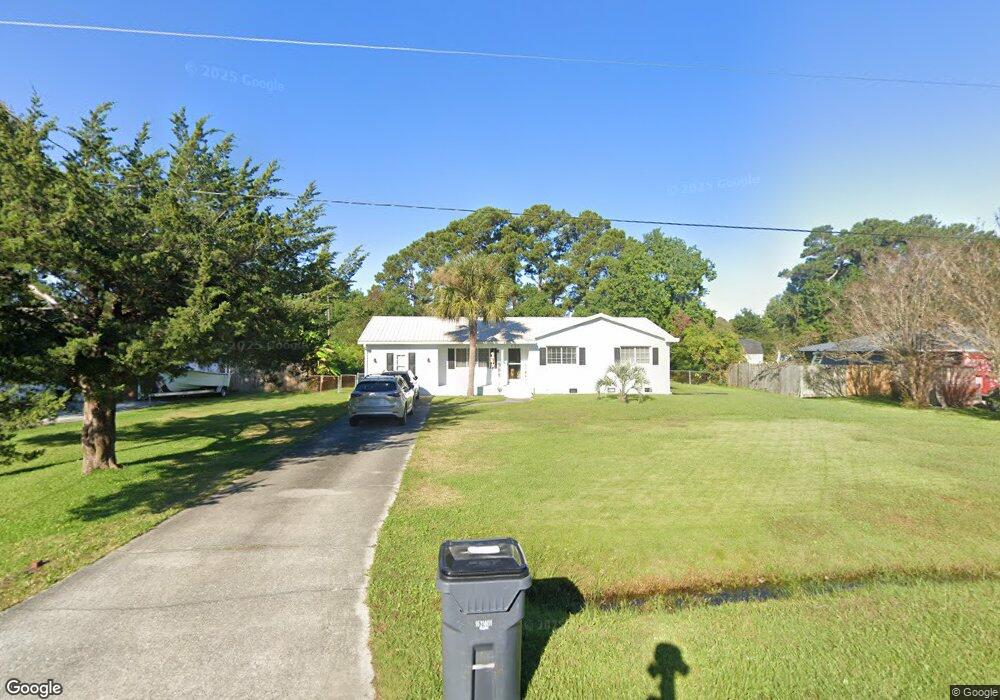
131 Horndale Dr Wilmington, NC 28409
Estimated Value: $302,000 - $368,000
3
Beds
2
Baths
1,219
Sq Ft
$263/Sq Ft
Est. Value
About This Home
This home is located at 131 Horndale Dr, Wilmington, NC 28409 and is currently estimated at $320,052, approximately $262 per square foot. 131 Horndale Dr is a home located in New Hanover County with nearby schools including Heyward C. Bellamy Elementary School, Myrtle Grove Middle School, and Eugene Ashley High School.
Ownership History
Date
Name
Owned For
Owner Type
Purchase Details
Closed on
Dec 29, 2017
Sold by
Farrell Josephe Michael and Farrell Cynthia M
Bought by
Berry Bruce D and Prehoda Leah
Current Estimated Value
Home Financials for this Owner
Home Financials are based on the most recent Mortgage that was taken out on this home.
Original Mortgage
$115,360
Outstanding Balance
$97,022
Interest Rate
3.9%
Mortgage Type
New Conventional
Estimated Equity
$223,030
Purchase Details
Closed on
Sep 11, 1995
Sold by
George Steven C Kelly S
Bought by
Farrell Joseph M Cynthia M
Purchase Details
Closed on
Dec 30, 1993
Sold by
Central Properties Inc
Bought by
George Steven C Kelly S
Purchase Details
Closed on
Jun 10, 1993
Sold by
Roberts Kenneth A Beth G
Bought by
Central Properties Inc
Purchase Details
Closed on
Mar 1, 1986
Sold by
C R Howell Building Inc
Bought by
Roberts Kenneth A Beth G
Purchase Details
Closed on
Mar 1, 1985
Sold by
Coley Barbara B Whitley
Bought by
C R Howell Building Inc
Purchase Details
Closed on
Mar 1, 1983
Bought by
Whitley Barbara B
Create a Home Valuation Report for This Property
The Home Valuation Report is an in-depth analysis detailing your home's value as well as a comparison with similar homes in the area
Home Values in the Area
Average Home Value in this Area
Purchase History
| Date | Buyer | Sale Price | Title Company |
|---|---|---|---|
| Berry Bruce D | $144,500 | Priority Title | |
| Farrell Joseph M Cynthia M | $78,000 | -- | |
| George Steven C Kelly S | $70,000 | -- | |
| Central Properties Inc | $55,000 | -- | |
| Roberts Kenneth A Beth G | $40,000 | -- | |
| C R Howell Building Inc | $38,500 | -- | |
| Whitley Barbara B | $25,500 | -- |
Source: Public Records
Mortgage History
| Date | Status | Borrower | Loan Amount |
|---|---|---|---|
| Open | Berry Bruce D | $115,360 |
Source: Public Records
Tax History Compared to Growth
Tax History
| Year | Tax Paid | Tax Assessment Tax Assessment Total Assessment is a certain percentage of the fair market value that is determined by local assessors to be the total taxable value of land and additions on the property. | Land | Improvement |
|---|---|---|---|---|
| 2025 | $1,359 | $339,600 | $133,900 | $205,700 |
| 2023 | $1,054 | $187,700 | $78,100 | $109,600 |
| 2022 | $1,058 | $187,700 | $78,100 | $109,600 |
| 2021 | $1,040 | $187,700 | $78,100 | $109,600 |
| 2020 | $912 | $144,200 | $44,600 | $99,600 |
| 2019 | $781 | $123,400 | $44,600 | $78,800 |
| 2018 | $781 | $123,400 | $44,600 | $78,800 |
| 2017 | $799 | $123,400 | $44,600 | $78,800 |
| 2016 | $818 | $118,000 | $44,600 | $73,400 |
| 2015 | $760 | $118,000 | $44,600 | $73,400 |
| 2014 | $747 | $118,000 | $44,600 | $73,400 |
Source: Public Records
Map
Nearby Homes
- 234 Brighton Rd
- 5109 Old Myrtle Grove Rd
- 4820 W Grove Dr
- 5014 Helms Port Ave
- 5705 Woodduck Cir
- 633 Piner Rd
- 5353 Leisure Cir
- 5225 Leisure Cir
- 1202 Beresford Ct
- 5418 Saltwater Run
- 273 Foxwood Ln
- 301 Foxwood Ln
- 5500 N Warrendale Ct
- 5205 Helms Port Ave
- 5010 Dockside Dr
- 5028 Laurenbridge Ln
- 222 Sea Gull Ln
- 5200 Woods Edge Rd
- 5004 Laurenbridge Ln
- 5610 Carolina Beach Rd Unit 13
- 135 Horndale Dr
- 127 Horndale Dr
- 123 Horndale Dr
- 139 Horndale Dr
- 132 Horndale Dr
- 119 Horndale Dr
- 143 Horndale Dr
- 136 Horndale Dr
- 128 Horndale Dr
- 124 Horndale Dr
- 140 Horndale Dr
- 115 Horndale Dr
- 147 Horndale Dr
- 120 Horndale Dr
- 144 Horndale Dr
- 116 Horndale Dr
- 111 Horndale Dr
- 151 Horndale Dr
- 105 Colchester Place
- 101 Colchester Place