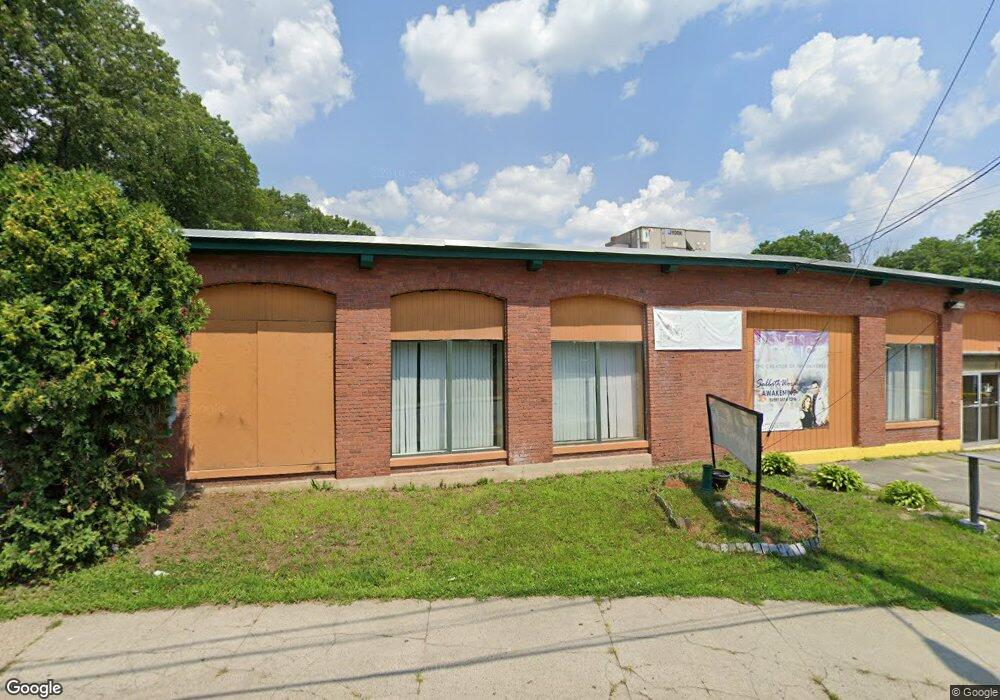
131 Mason St Woonsocket, RI 02895
Constitution Hill NeighborhoodEstimated Value: $1,456,827
Studio
--
Bath
38,000
Sq Ft
$38/Sq Ft
Est. Value
About This Home
This home is located at 131 Mason St, Woonsocket, RI 02895 and is currently estimated at $1,456,827, approximately $38 per square foot. 131 Mason St is a home located in Providence County with nearby schools including Woonsocket High School, Rise Prep Mayoral Academy Middle School, and Rise Prep Mayoral Academy.
Ownership History
Date
Name
Owned For
Owner Type
Purchase Details
Closed on
Jun 3, 2022
Sold by
3M Raelty Llc
Bought by
Jpt Realty Llc
Current Estimated Value
Home Financials for this Owner
Home Financials are based on the most recent Mortgage that was taken out on this home.
Original Mortgage
$935,000
Outstanding Balance
$880,437
Interest Rate
5.1%
Mortgage Type
Purchase Money Mortgage
Estimated Equity
$576,390
Purchase Details
Closed on
Nov 23, 2015
Sold by
Amco Inc
Bought by
3M Realty Llc
Purchase Details
Closed on
Jun 9, 2015
Sold by
Amco Inc
Bought by
3M Realty Llc
Home Financials for this Owner
Home Financials are based on the most recent Mortgage that was taken out on this home.
Original Mortgage
$350,000
Interest Rate
3.62%
Mortgage Type
Commercial
Purchase Details
Closed on
Dec 7, 2005
Sold by
Fairmont Foundry Assoc
Bought by
Amco Inc
Create a Home Valuation Report for This Property
The Home Valuation Report is an in-depth analysis detailing your home's value as well as a comparison with similar homes in the area
Home Values in the Area
Average Home Value in this Area
Purchase History
| Date | Buyer | Sale Price | Title Company |
|---|---|---|---|
| Jpt Realty Llc | $1,100,000 | None Available | |
| 3M Realty Llc | -- | -- | |
| 3M Realty Llc | -- | -- | |
| Amco Inc | $225,000 | -- |
Source: Public Records
Mortgage History
| Date | Status | Borrower | Loan Amount |
|---|---|---|---|
| Open | Jpt Realty Llc | $935,000 | |
| Previous Owner | Amco Inc | $350,000 | |
| Previous Owner | Amco Inc | $200,000 | |
| Previous Owner | Amco Inc | $50,000 | |
| Previous Owner | Amco Inc | $150,000 |
Source: Public Records
Tax History
| Year | Tax Paid | Tax Assessment Tax Assessment Total Assessment is a certain percentage of the fair market value that is determined by local assessors to be the total taxable value of land and additions on the property. | Land | Improvement |
|---|---|---|---|---|
| 2025 | $12,967 | $608,800 | $136,500 | $472,300 |
| 2024 | $14,207 | $547,700 | $114,700 | $433,000 |
| 2023 | $14,207 | $547,700 | $114,700 | $433,000 |
| 2022 | $0 | $547,700 | $114,700 | $433,000 |
| 2021 | $15,724 | $452,500 | $108,900 | $343,600 |
| 2020 | $15,946 | $452,500 | $108,900 | $343,600 |
| 2018 | $16,376 | $452,500 | $108,900 | $343,600 |
| 2017 | $11,101 | $300,600 | $99,700 | $200,900 |
| 2016 | $11,525 | $300,600 | $99,700 | $200,900 |
| 2015 | $12,234 | $300,600 | $99,700 | $200,900 |
| 2014 | -- | $280,000 | $110,500 | $169,500 |
Source: Public Records
Map
Nearby Homes
- 0 Holbrook Ln Unit 1402850
- 435 S Main St
- 83 4th Ave
- 123 4th Ave
- 120 East St
- 190 Coe St
- 43 Summit St
- 84 Bernice Ave
- 92 Rockland Ave
- 42 Transit St
- 36 Fairmount St
- 184 Avenue C Unit 2
- 184 Avenue C Unit 5
- 184 Avenue C Unit 6
- 184 Avenue C Unit 3
- 184 Avenue C Unit 4
- 184 Avenue C Unit 1
- 0 10th Ave
- 10 10th Ave
- 379 Front St
Your Personal Tour Guide
Ask me questions while you tour the home.